Selected work — Product & UX

Projects

Product design and UI/UX case studies — from research and synthesis to the screens that shipped.

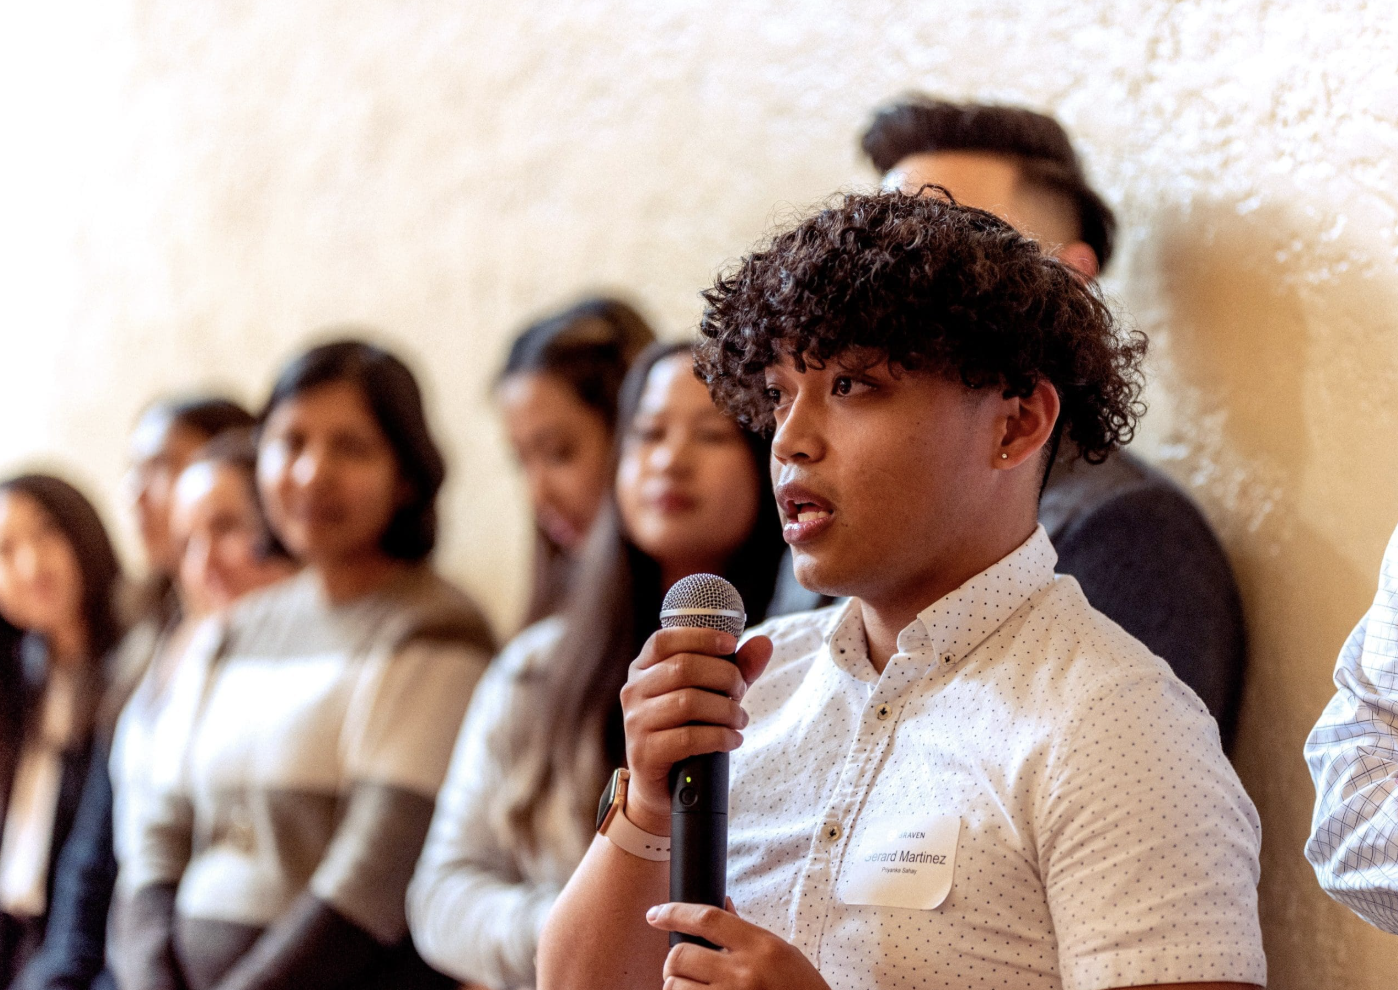
Braven Connect cover
01 Mobile app · Research to product

Braven Connect

Braven assumed students wanted more career information. Our research showed they wanted a clear next step and direct, 1:1 contact — so we designed the mobile app around a personalised career roadmap, from wireframes to six production-ready screens.

Role
UI/UX Consultant · TODO — what you owned
Timeline
Jan – May 2025
Team
8 consultants · Berkeley Consulting Collaborative
Tools
Figma, FigJam, survey analysis
Mobile UIUX ResearchPersonasFigma
At a glance

From “more information” to “a clear next step”

Client
Braven, a career-readiness nonprofit for students at public universities
Challenge
Braven believed students needed more career information. We tested that assumption.
My part
TODO — 1 sentence on what YOU owned, e.g. “led the class-year split and designed the Roadmap + My Tasks screens”
Delivered
4 class-year personas and 6 production-ready mobile screens in Figma
Result
TODO — what Braven did with it, or a number
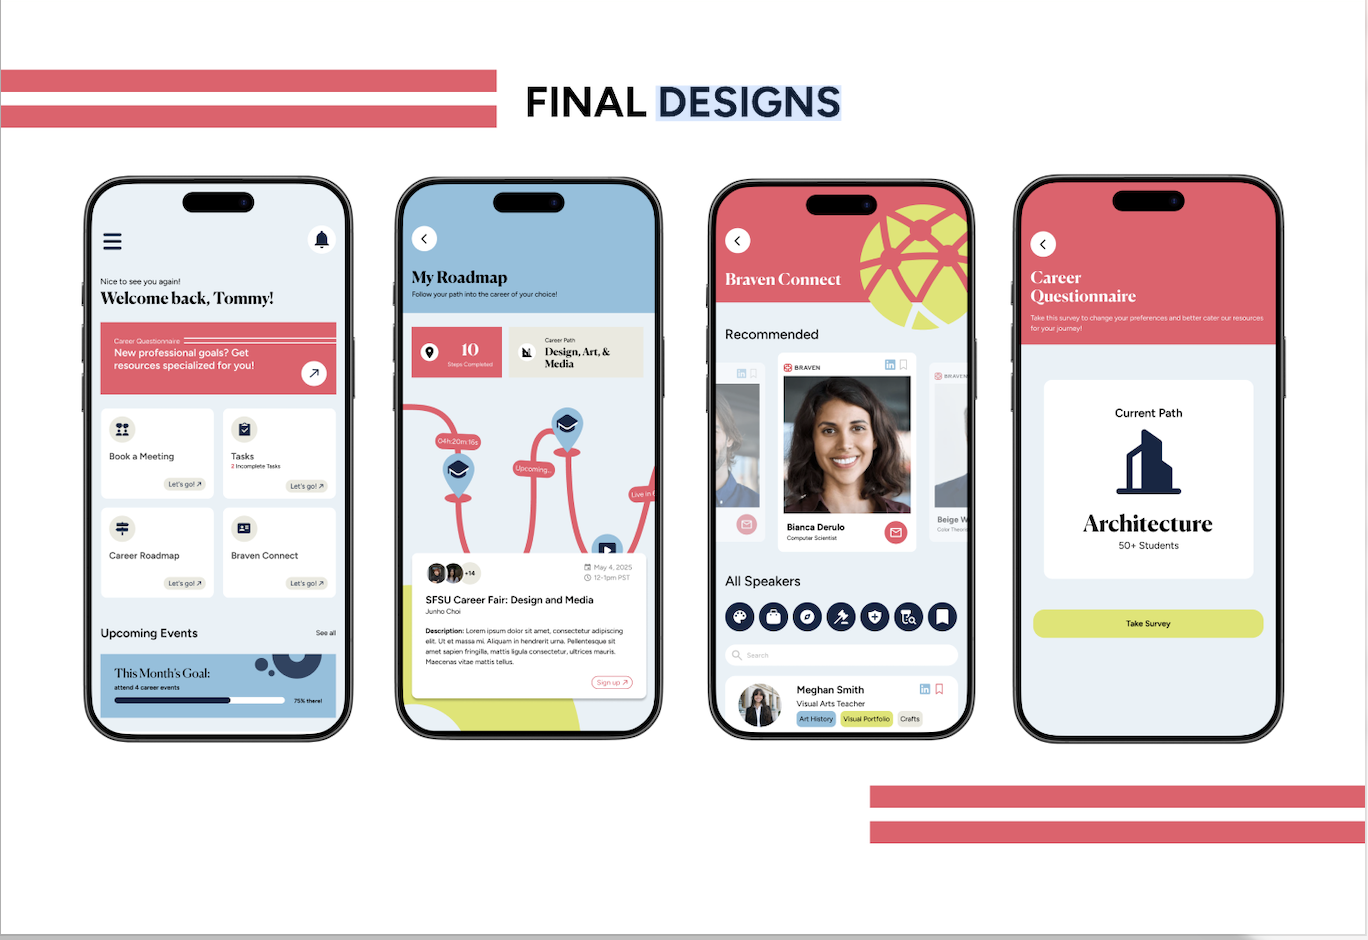
Braven Connect — final high-fidelity mobile screens
The insight

Braven assumed students needed more career information. They didn’t. Students picked virtual events because they were short on time — and what they actually wanted was direct, 1:1 contact with mentors and employers, with needs that changed sharply by class year.

Research · Jan – Mar 2025

One survey, four very different students

We surveyed undergraduates at public four-year universities, charted the responses, and affinity-mapped them in FigJam. One general persona proved too coarse to design for, so we split the data by class year. Three findings shaped everything after:
  • Time is the barrier. Convenience was overwhelmingly why students chose virtual events at all.
  • They want the outcome, not the homework. Students wanted the end result but lacked the steps to get there.
  • Needs shift by year. First- and second-years need direction and low-pressure contact; third- and fourth-years want resume help and direct access to employers.

TODO — your part of the research, e.g. which cohort or analysis you led

Braven — four class-year personas
Decision 01

Lead with a roadmap, not a content feed

Because students “want the result but lack the steps,” the app opens on a personalised Career Roadmap and My Tasks — a short list of next actions — instead of a feed of events and videos. A short Career Questionnaire sets the roadmap, so one app serves all four class years.

Trade-off: TODO — what you considered and rejected, and what this choice cost
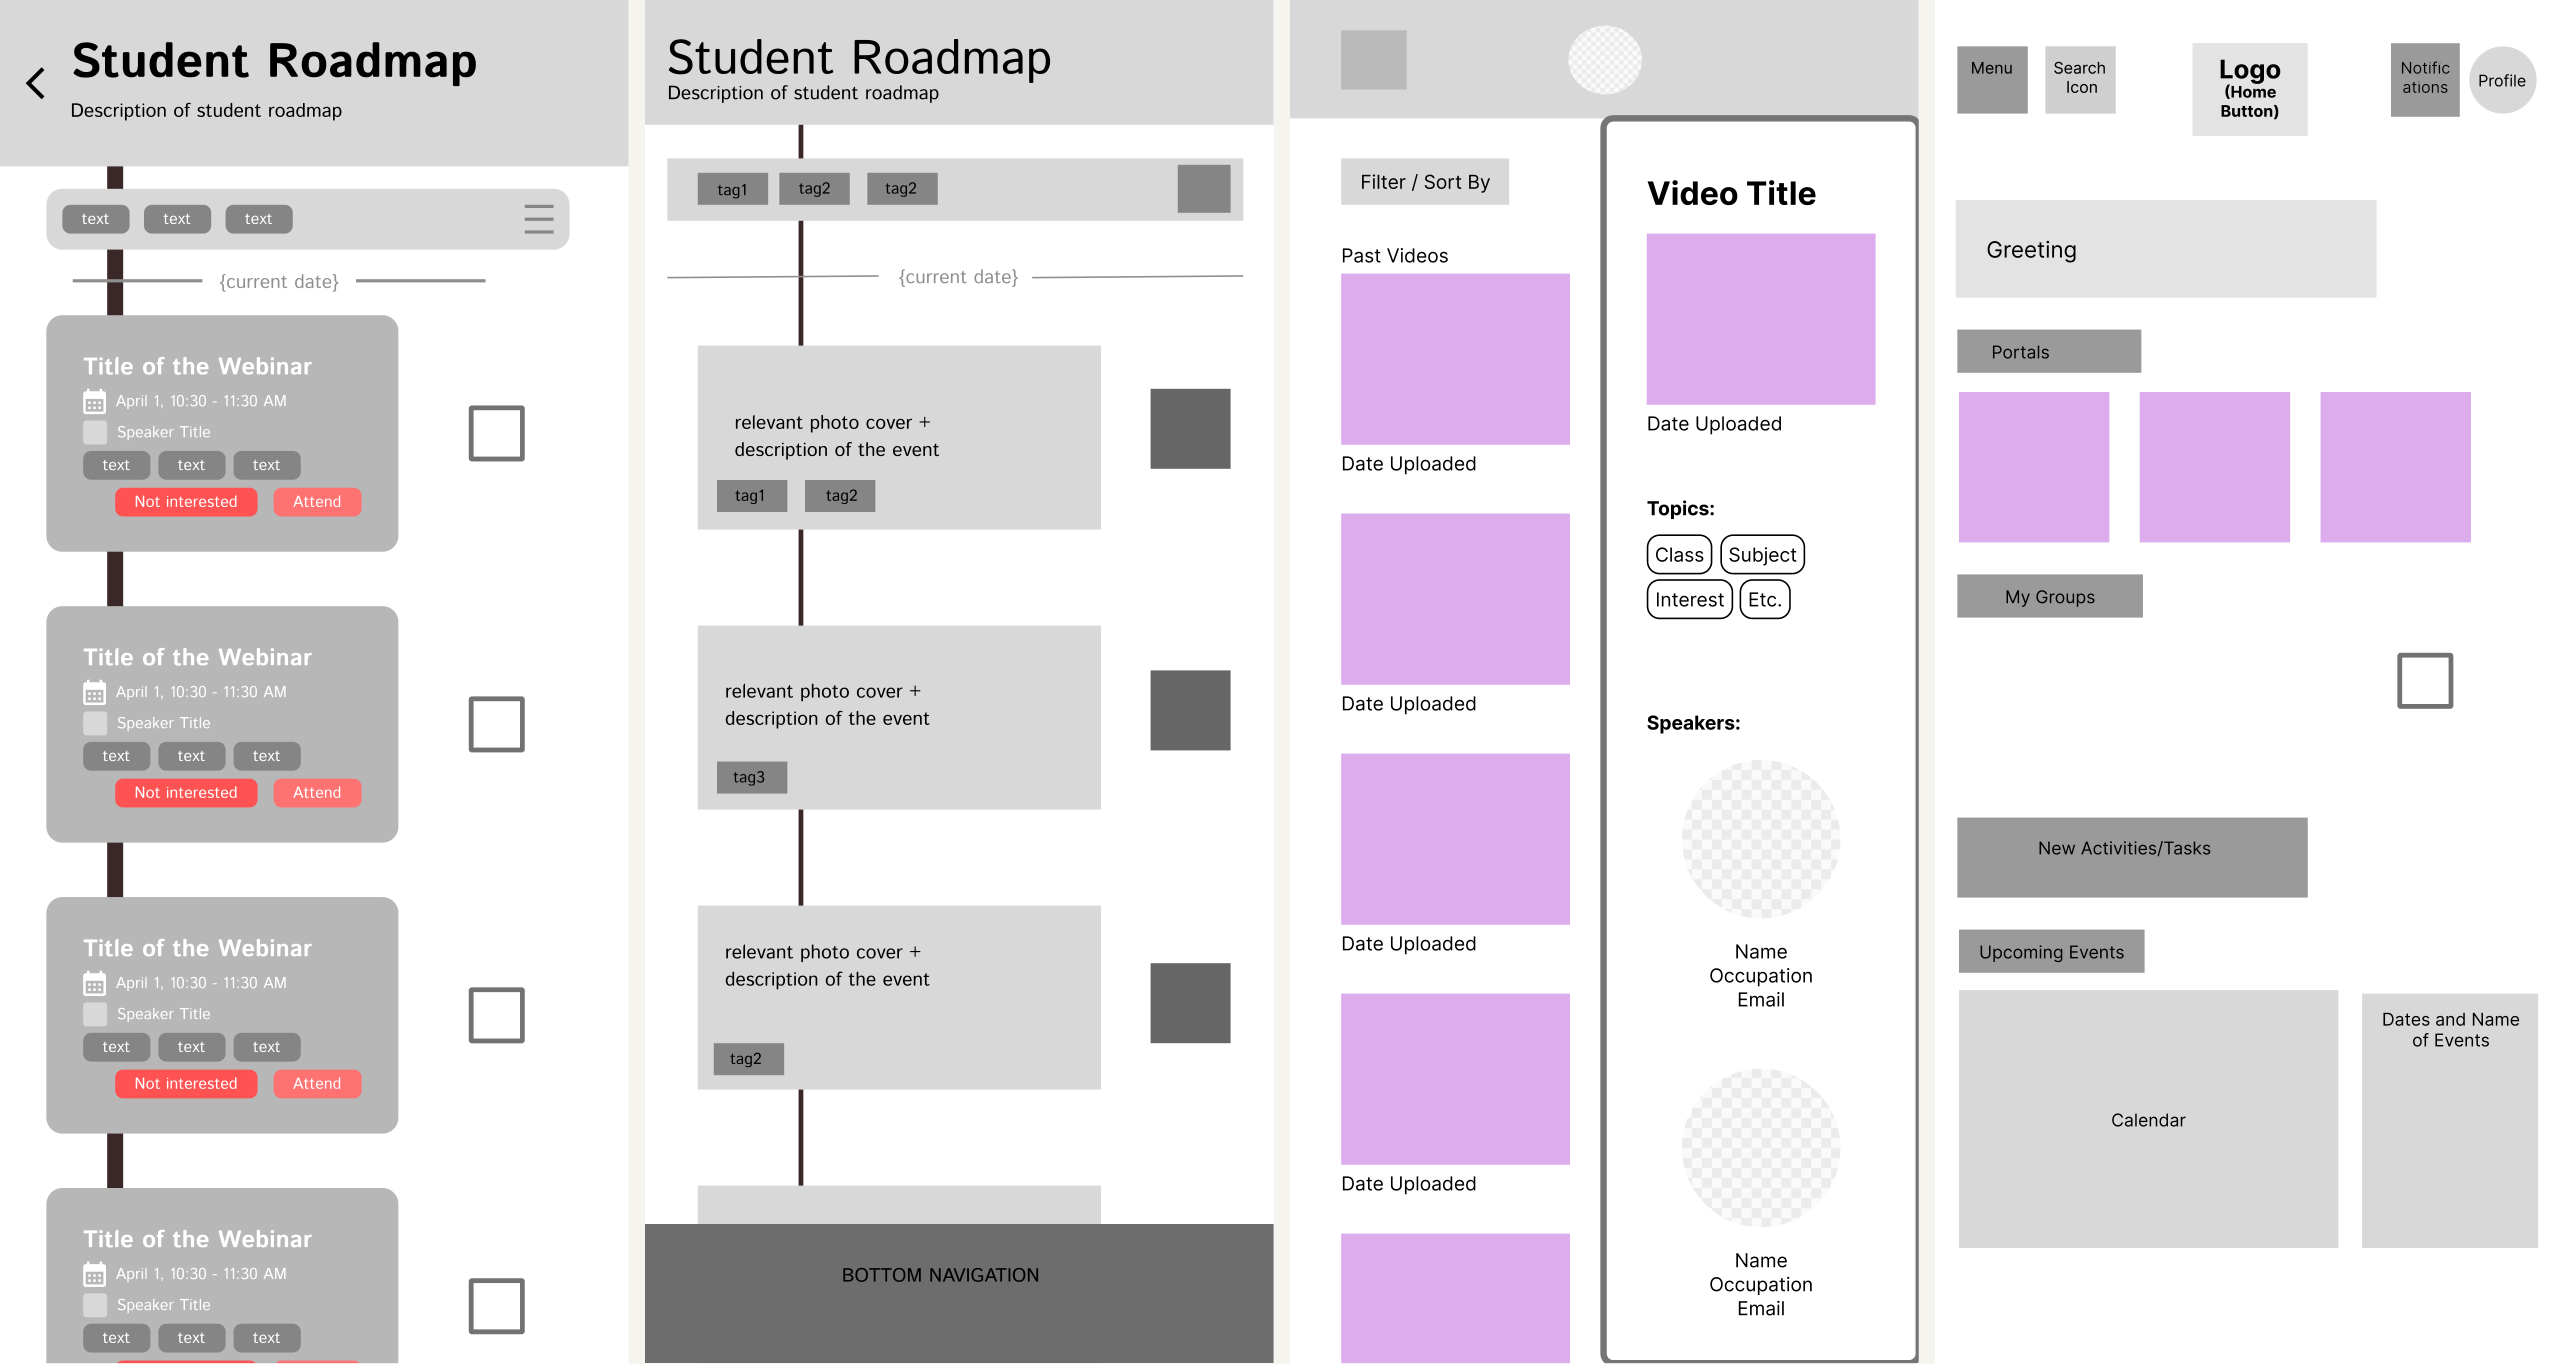
Braven low-fidelity wireframes — Student Roadmap, Events, Past Videos, Home
Decision 02

Point every screen toward a person

Every cohort ranked 1:1 contact above more information. The Events calendar and Braven Connect speaker library are built to lead students to a mentor, speaker, or employer they can actually reach — fewer webinars, more people.

Trade-off: TODO — check this matches the real design, then add the trade-off
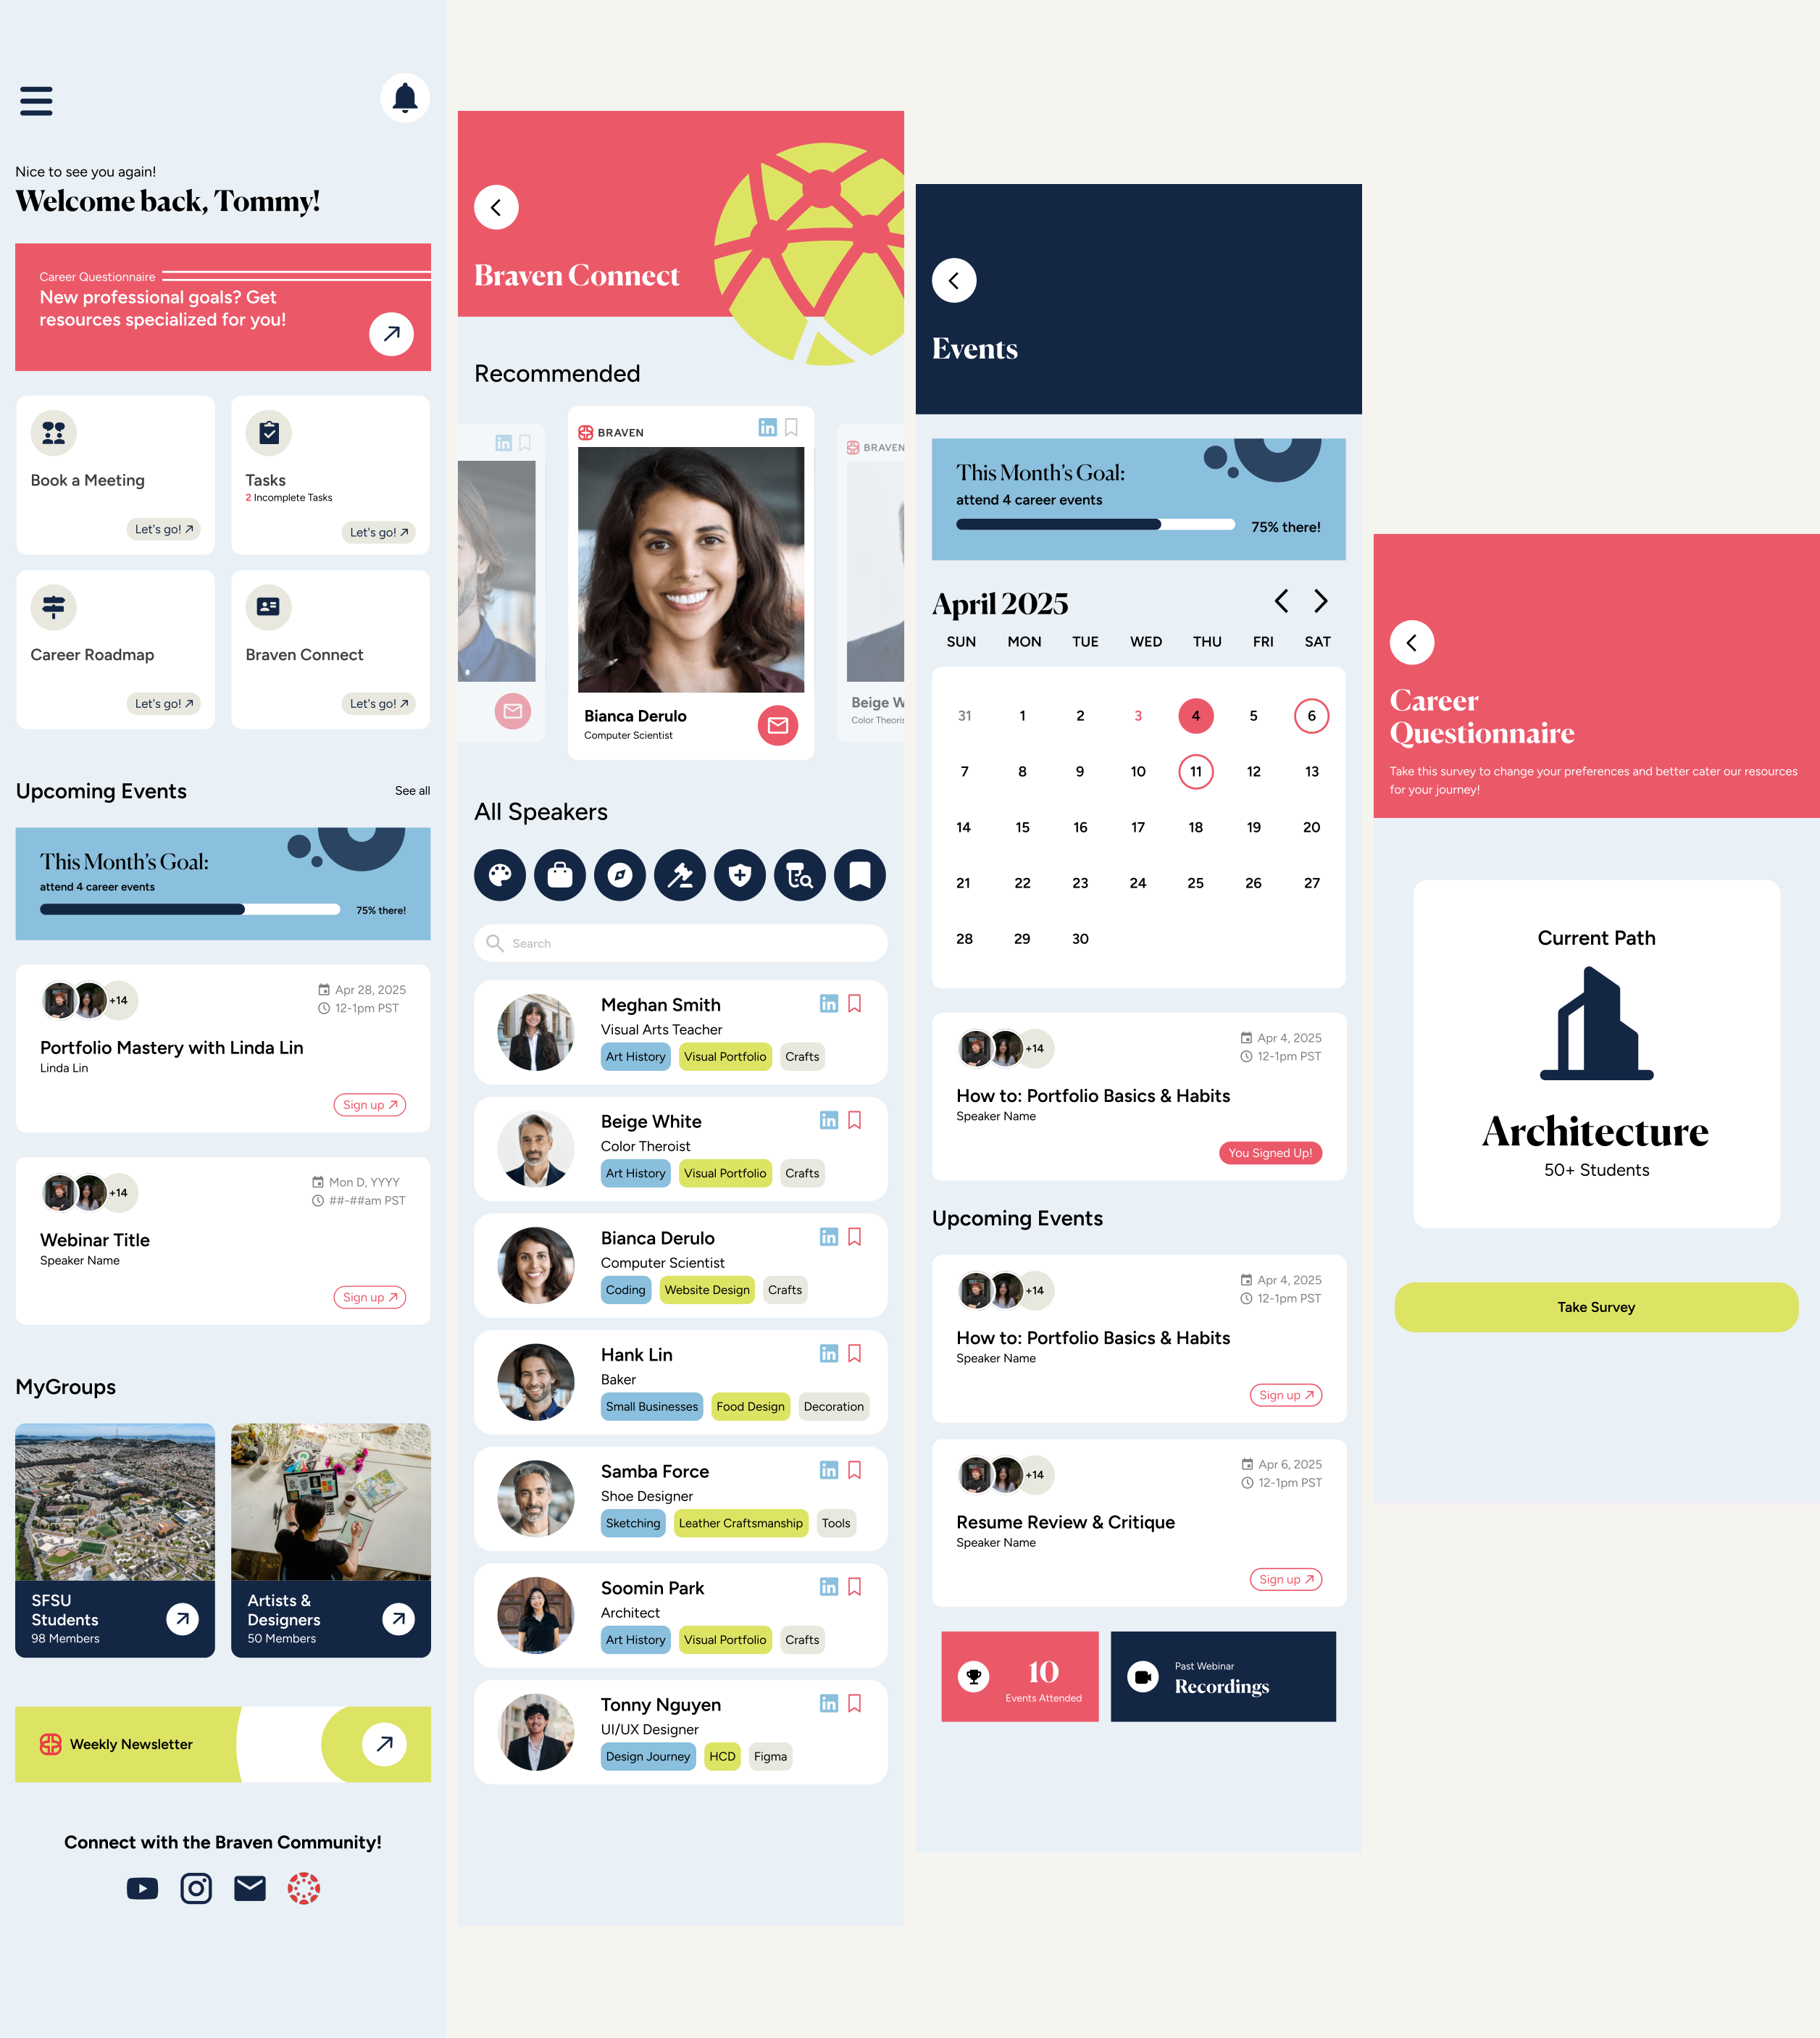
Braven high-fidelity mockups — Welcome, Braven Connect, Events, Career Questionnaire
Iteration · Apr – May 2025

Structure first, then brand

We tested the information architecture and navigation with the Braven team as grey-and-purple wireframes before any visual design. Only then did we apply Braven’s navy, coral and butter-yellow brand to the approved flows.

What changed: TODO — 1–2 things Braven’s feedback changed between lo-fi and hi-fi

TODO — before / after of one screen
Outcome & reflection

Delivered four class-year personas and six production-ready screens to Braven.

TODO — what Braven adopted or built next, or any metric

What I’d do differently: put a clickable prototype in front of a few students from each class year before hand-off. We validated the structure with Braven’s team, but never with students themselves.

01 / 07
Mozilla Firefox cover
02 Browser extension · Research to UI

Mozilla Firefox

Researched how people feel about trading performance for battery life, then designed and built a Firefox extension that makes tab memory and CPU use visible.

Role
IT Consultant (research & UI)
Timeline
Aug 2025 – Feb 2026
Team
12 consultants · Invention Corps of Berkeley
Tools
Figma, FigJam, React, Vite
User ResearchSurvey DesignFigmaReactVite
The problem

Firefox wanted to explore an Adaptive Performance mode that throttles idle tabs. The open questions: do users care about eco features, what would convince them, and how much speed would they give up for battery?

Phase 01 · Aug 2025

Project framing — Adaptive Performance

Started from a hypothesis: most browsers waste battery on idle tabs, and Firefox could differentiate with an Adaptive Performance mode that intelligently throttles based on usage. Defined the open questions we’d need to answer with users: do they care about eco features, what data would convince them, and how much performance loss is acceptable in exchange for battery gain?
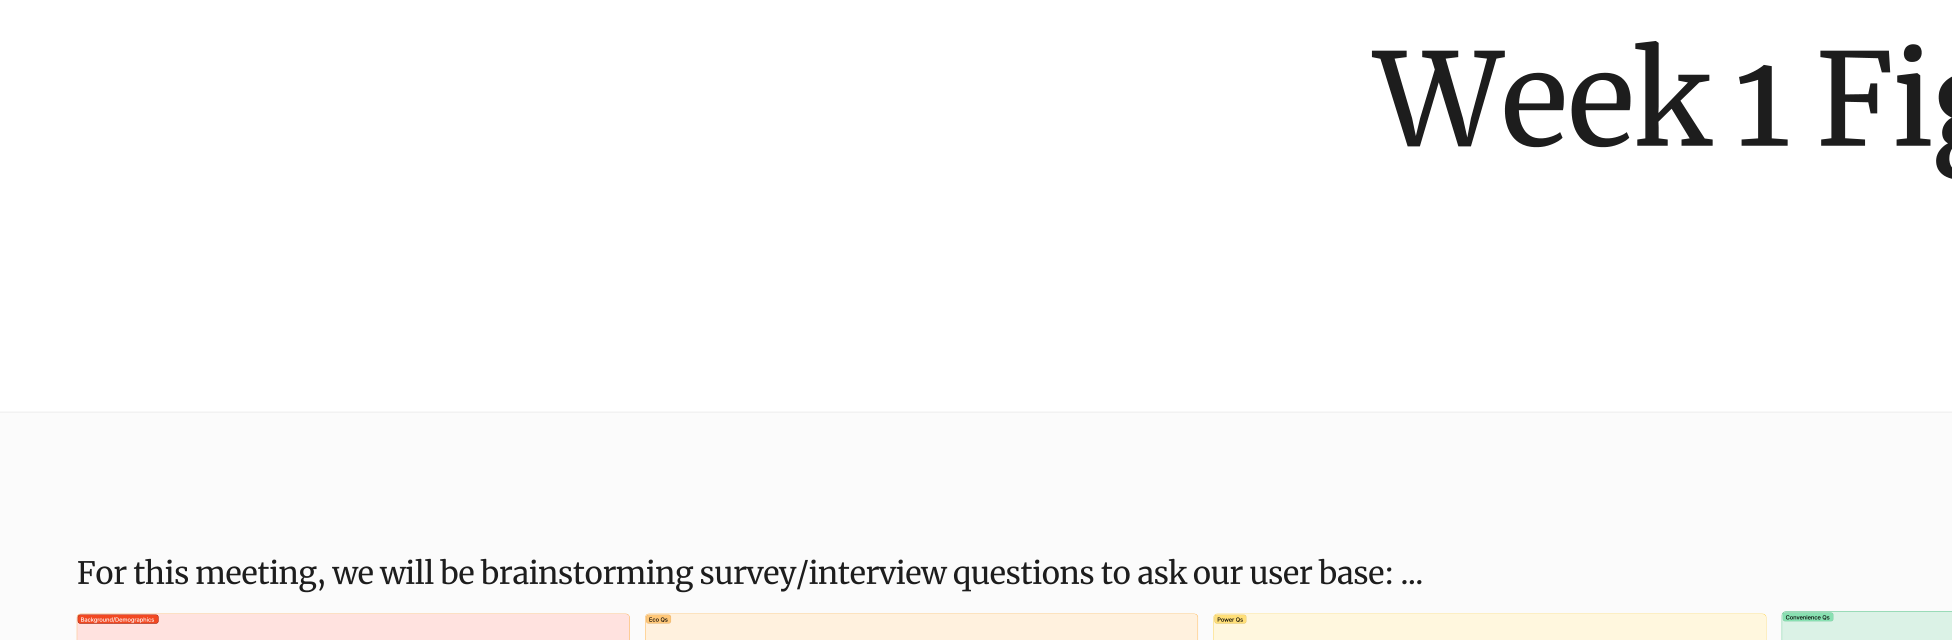
Mozilla — Week 1 Figjam framing
Phase 02 · Sep 2025 (Week 1)

Survey question brainstorm

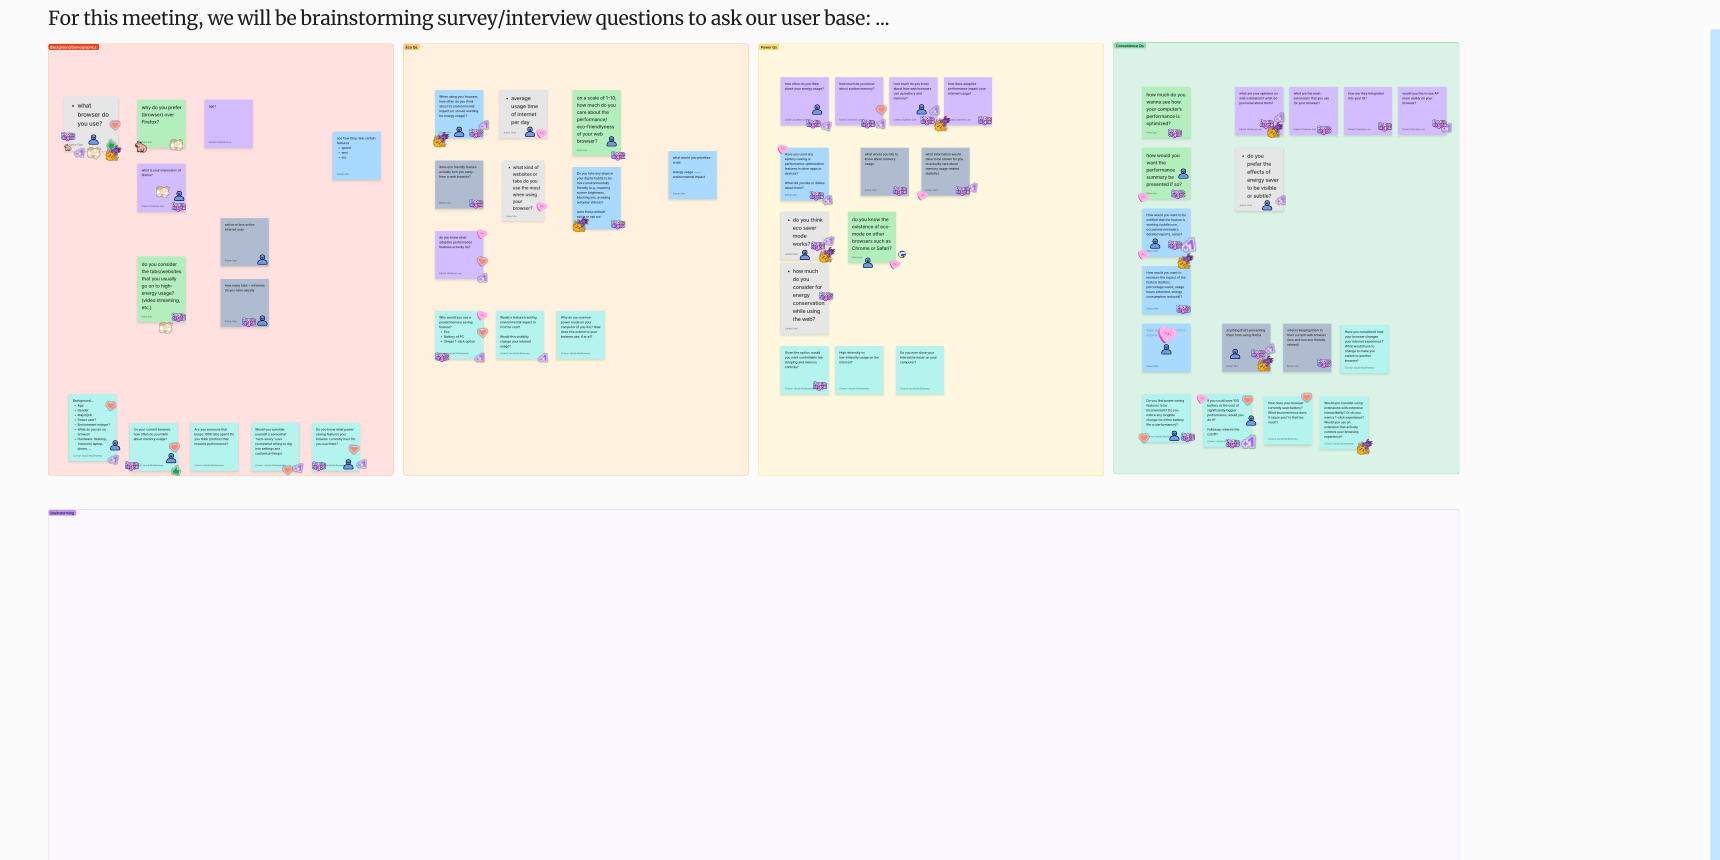
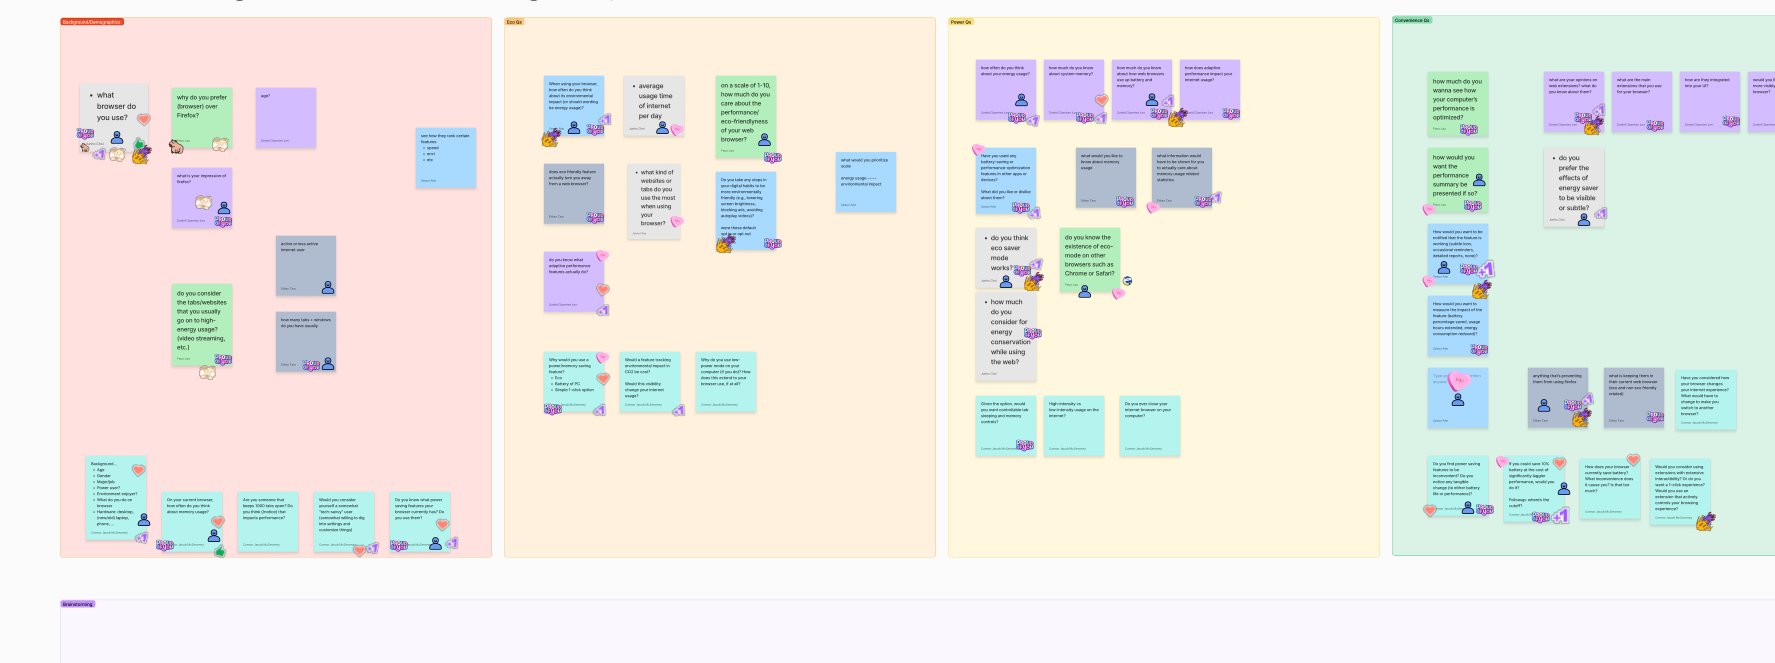
The 12-person team filled a FigJam board with raw interview/survey question candidates — each consultant contributing from their angle. Questions ranged from blunt (“why do you prefer your browser over Firefox?”) to specific (“if you could save 10% battery at the cost of significantly laggier performance, would you?”).
Mozilla — survey question brainstorm sticky-note board
Phase 03 · Sep 2025

Categorize into themes

Grouped the brainstorm into five working buckets that became the spine of the eventual questionnaire:
  • Background / Demographics — age, browser of choice, hardware, power-user level
  • Eco Qs — environmental motivation, willingness to trade speed for sustainability
  • Power Qs — current habits around tab sleeping, low-power modes, memory awareness
  • Convenience Qs — 1-click vs. customizable, visibility preferences for feature output
  • Extensions — how integrated browser extensions are into the user’s daily flow
Mozilla — categorized question clusters (Eco / Power / Convenience / Background)
Phase 04 · Oct 2025

Survey structuring

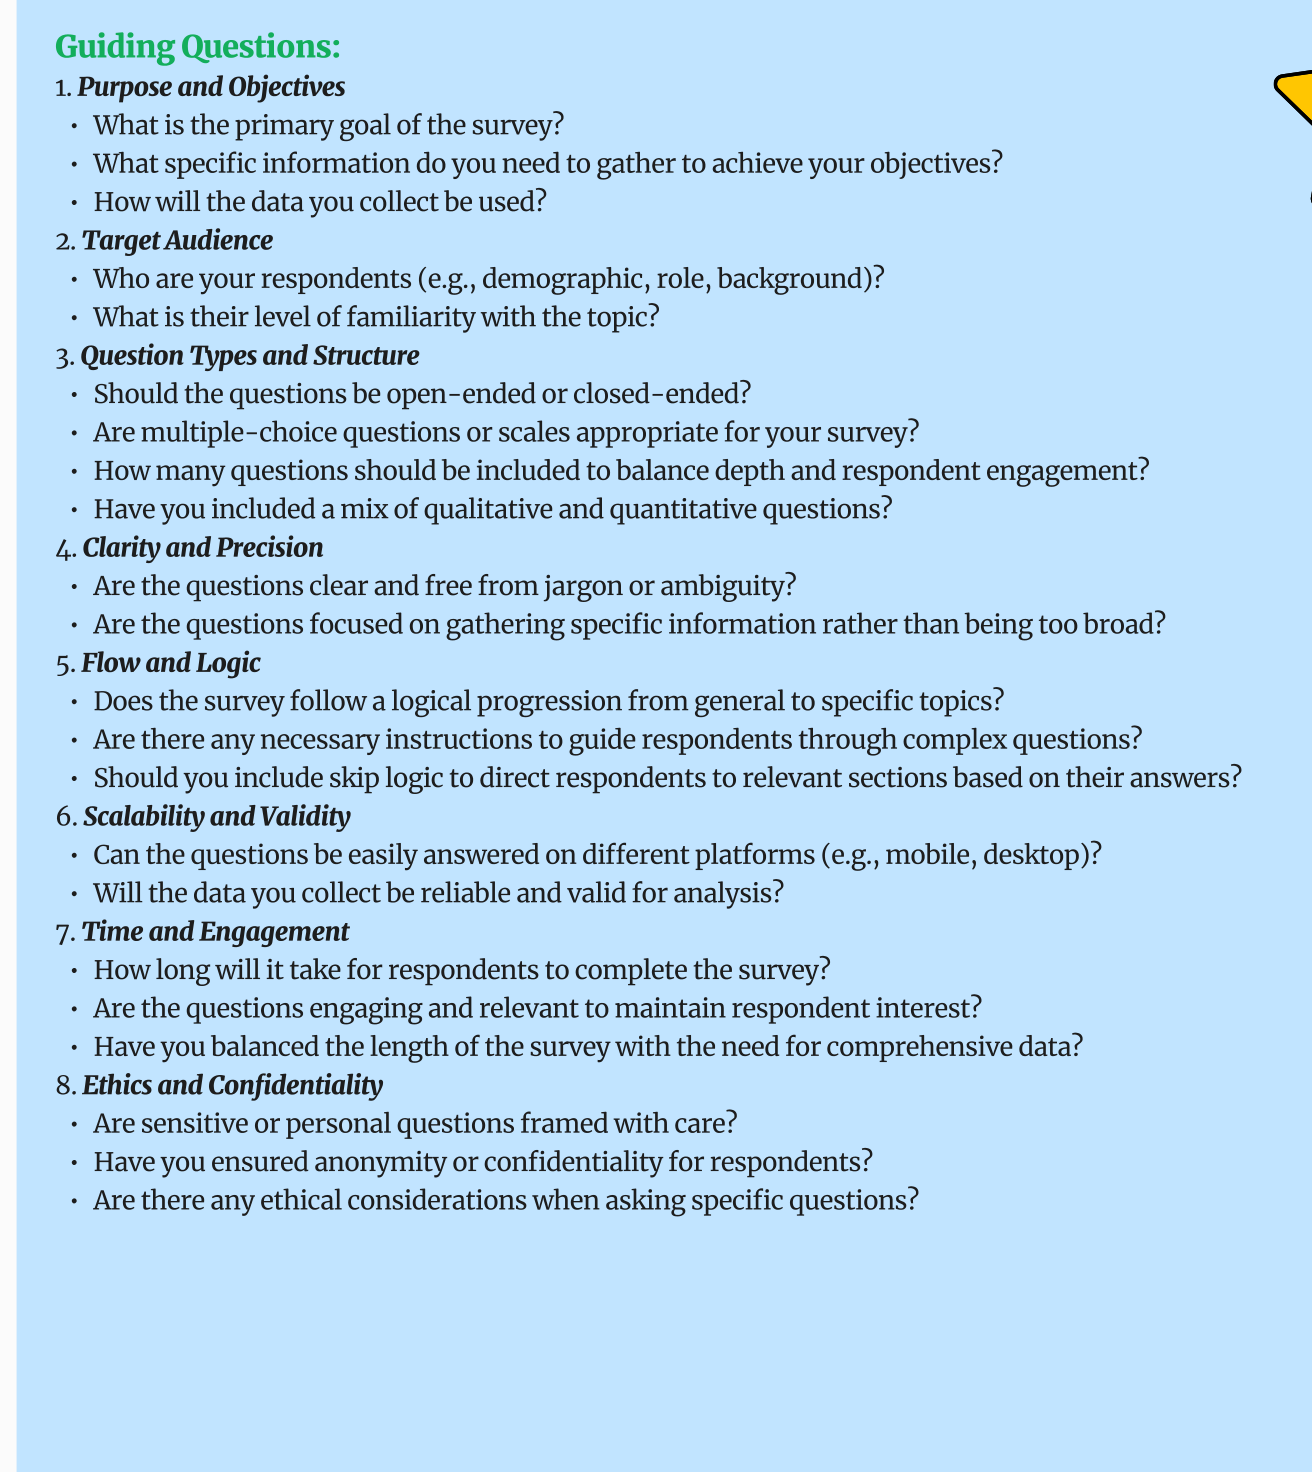
Pressure-tested the brainstorm against eight guiding criteria — purpose, target audience, question types, clarity, flow/logic, scalability, time-to-complete, and ethics. The result: a coherent survey that flows from general to specific, mixes qualitative and quantitative items, and stays under a respondent-friendly length.
Mozilla — Guiding Questions framework (8 criteria)
Phase 05 · Oct – Nov 2025

Final survey assembly & distribution

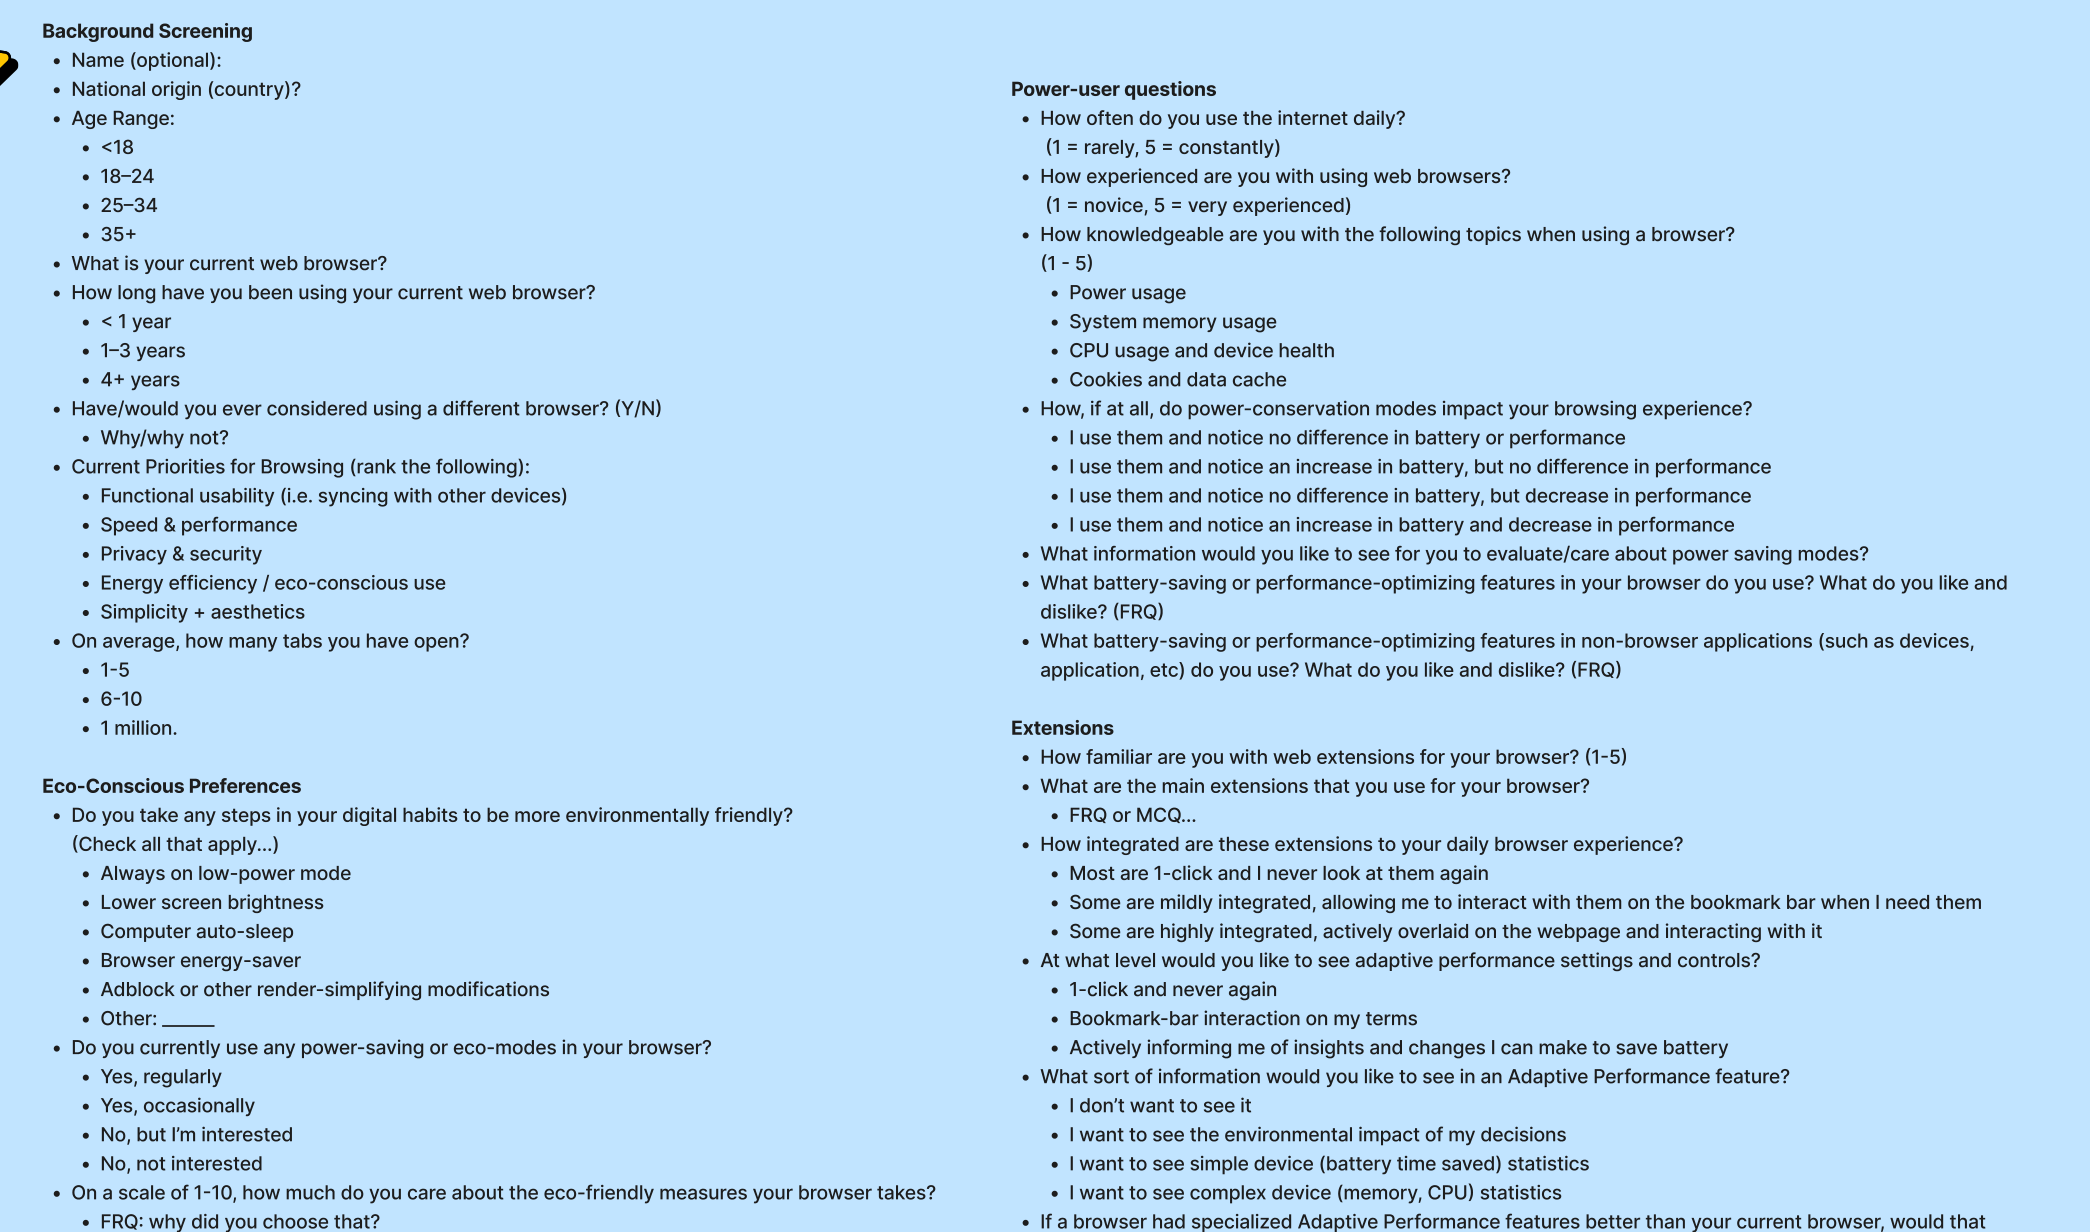
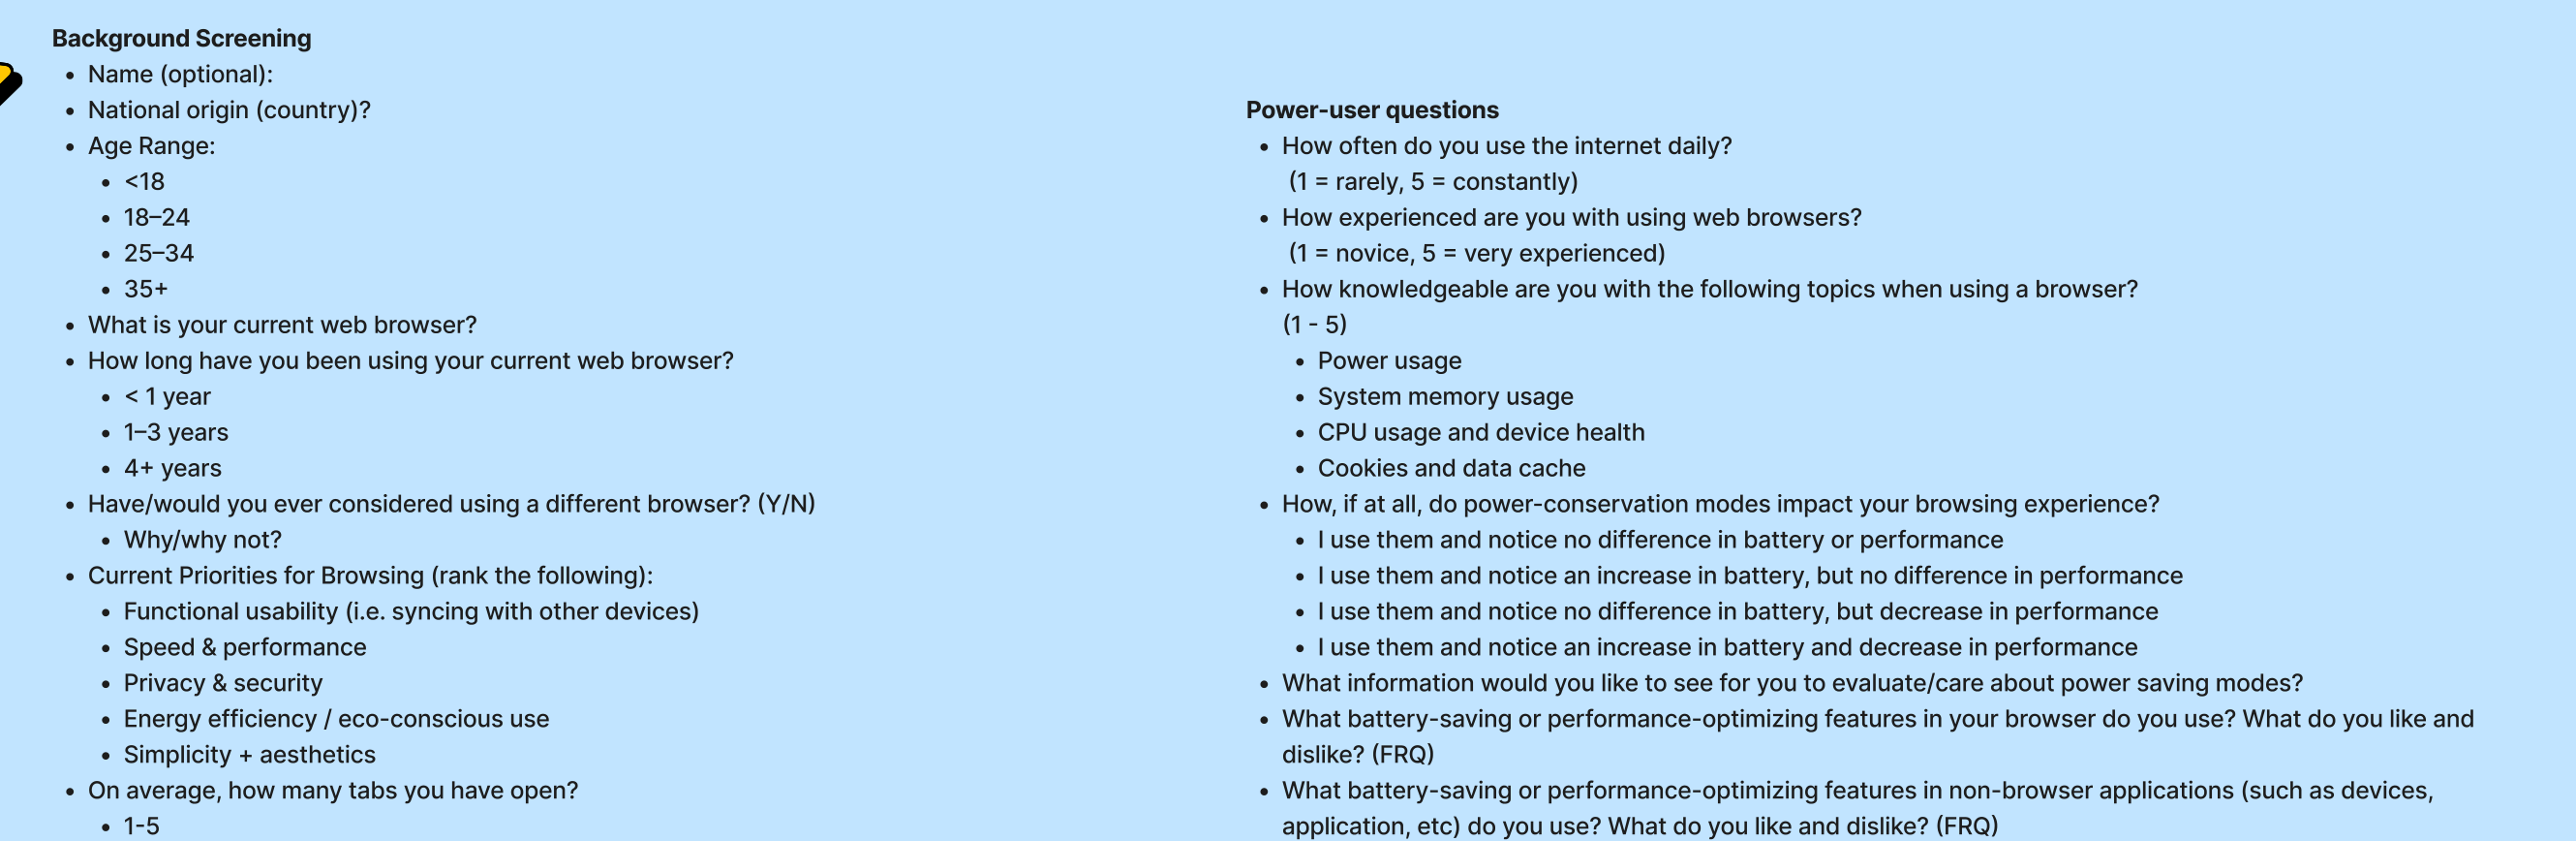
Consolidated the brainstorm into a clean, multi-section instrument: Background Screening, Eco-Conscious Preferences, Power-user Questions, Extensions, Browser Usage & Experience, and Final Questions. Distributed across the team’s networks; collected enough responses to read both broad signals and edge cases.
Mozilla — final structured survey (Background / Eco / Power / Extensions)
Phase 06 · Dec 2025 – Feb 2026

Build — tab-performance extension

Took the survey insights into engineering. Built a Firefox extension in React + Vite that tracks 50+ concurrent tabs in real time and lets users filter and sort by memory and CPU usage — the “visibility” signal the survey identified as the missing piece in current eco-mode UIs. Designed the UI in Figma with the 12-person team split across frontend and backend tracks.
Mozilla — final survey + Adaptive Performance question set
Outcome & reflection

TODO — survey response count, key findings, extension screens / demo

01 / 08
Urban Conga cover
03 Interactive installation · Spatial UX

Urban Conga

Designed a data-informed public installation system that measures how people actually use civic, park, and commercial spaces — from behavioral survey to Rhino layout.

Role
UX Design Consultant
Timeline
Jan – Jun 2026
Team
9 consultants · Invention Corps of Berkeley
Tools
Rhino 3D, FigJam, survey analysis
UX ResearchData SchemasRhino 3DSpatial Design
The problem

Urban Conga’s installations had no way to show how people engaged with them. The goal: capture real usage patterns with low-cost sensing, without making people uncomfortable in public.

Phase 01 · Jan – Feb 2026

Public-space behavioral survey

Built and distributed a survey across the team’s networks asking people how they actually use civic squares, parks, and commercial spaces — group size, time of day, length of stay, deal-breakers, and what they’d feel comfortable doing in public. The goal: capture real behavior, not assumptions, before any installation design started.
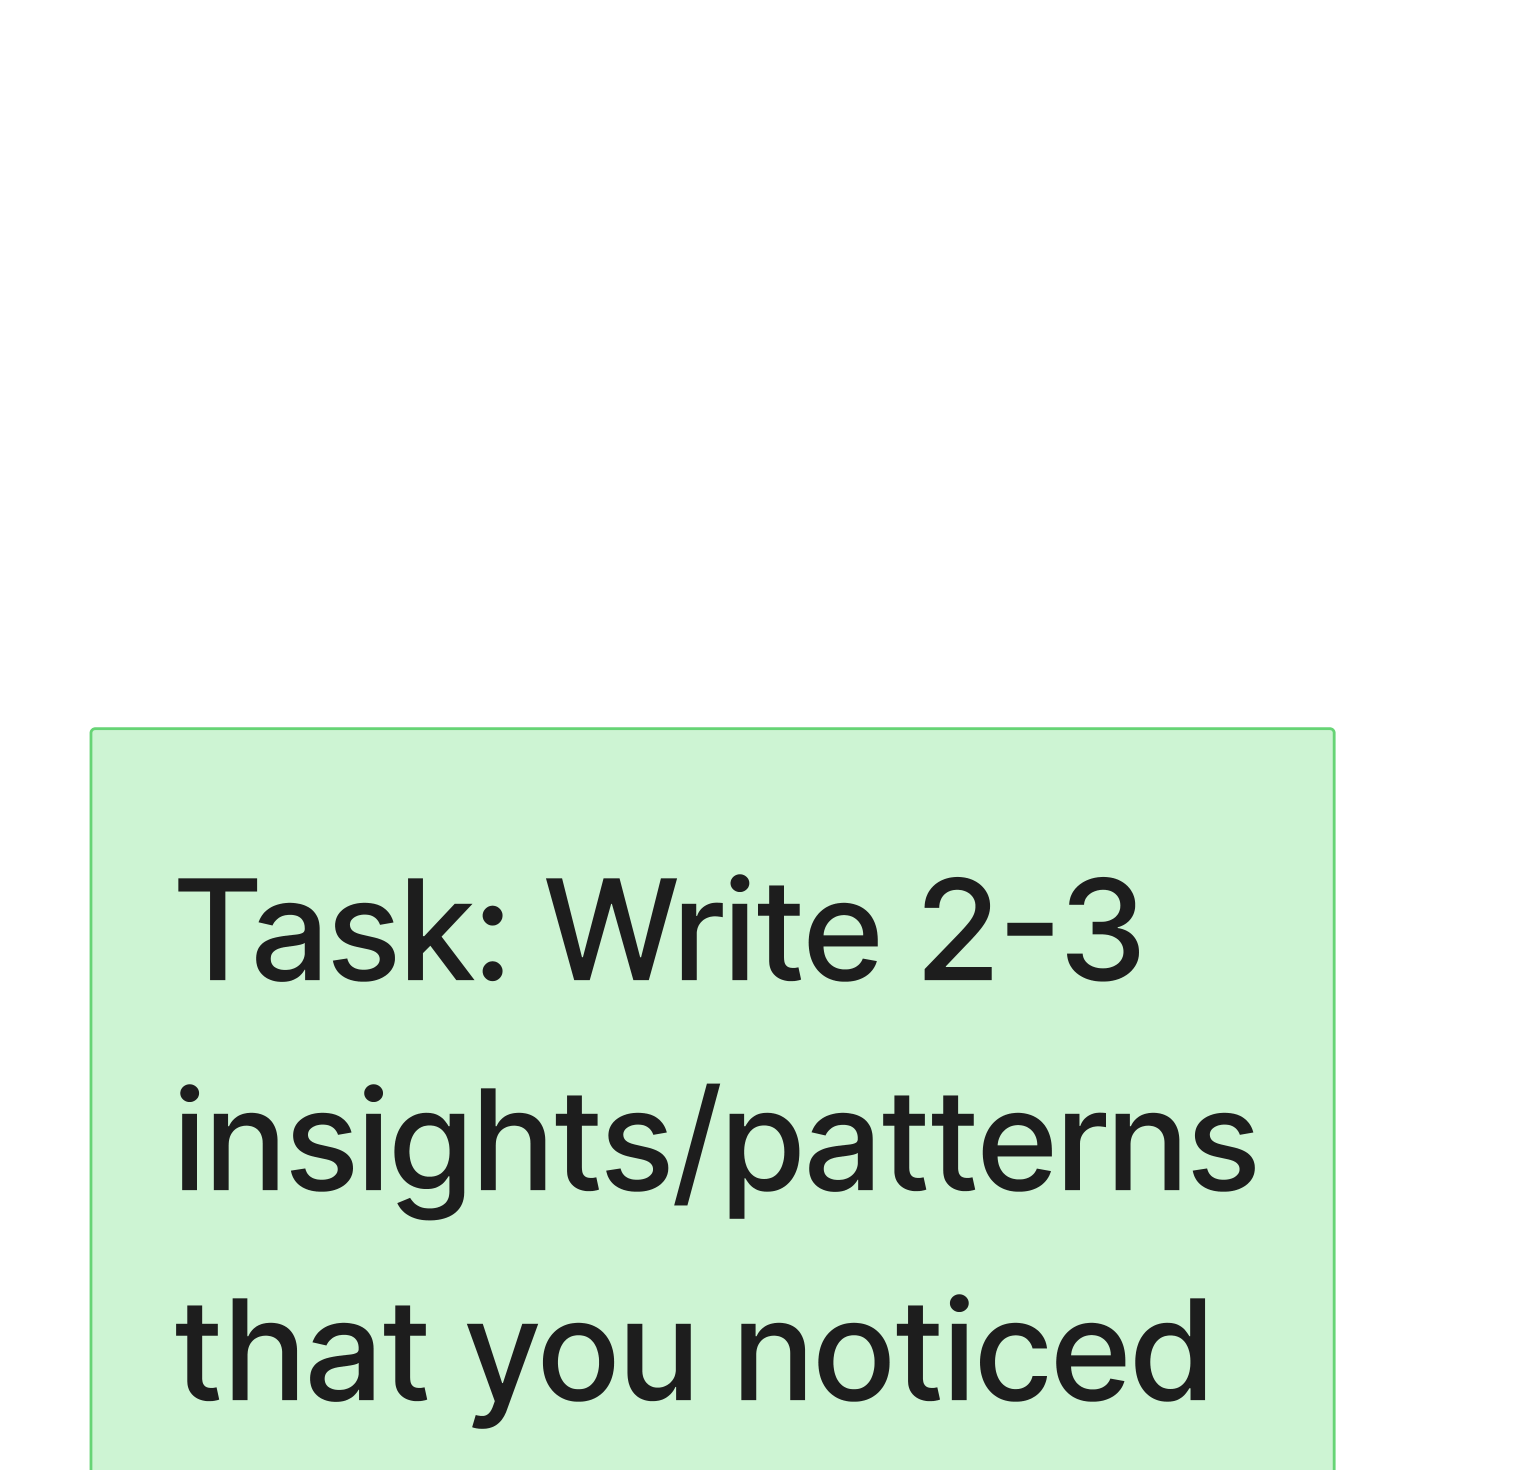
Urban Conga — survey task
Phase 02 · Feb 2026

Insight extraction

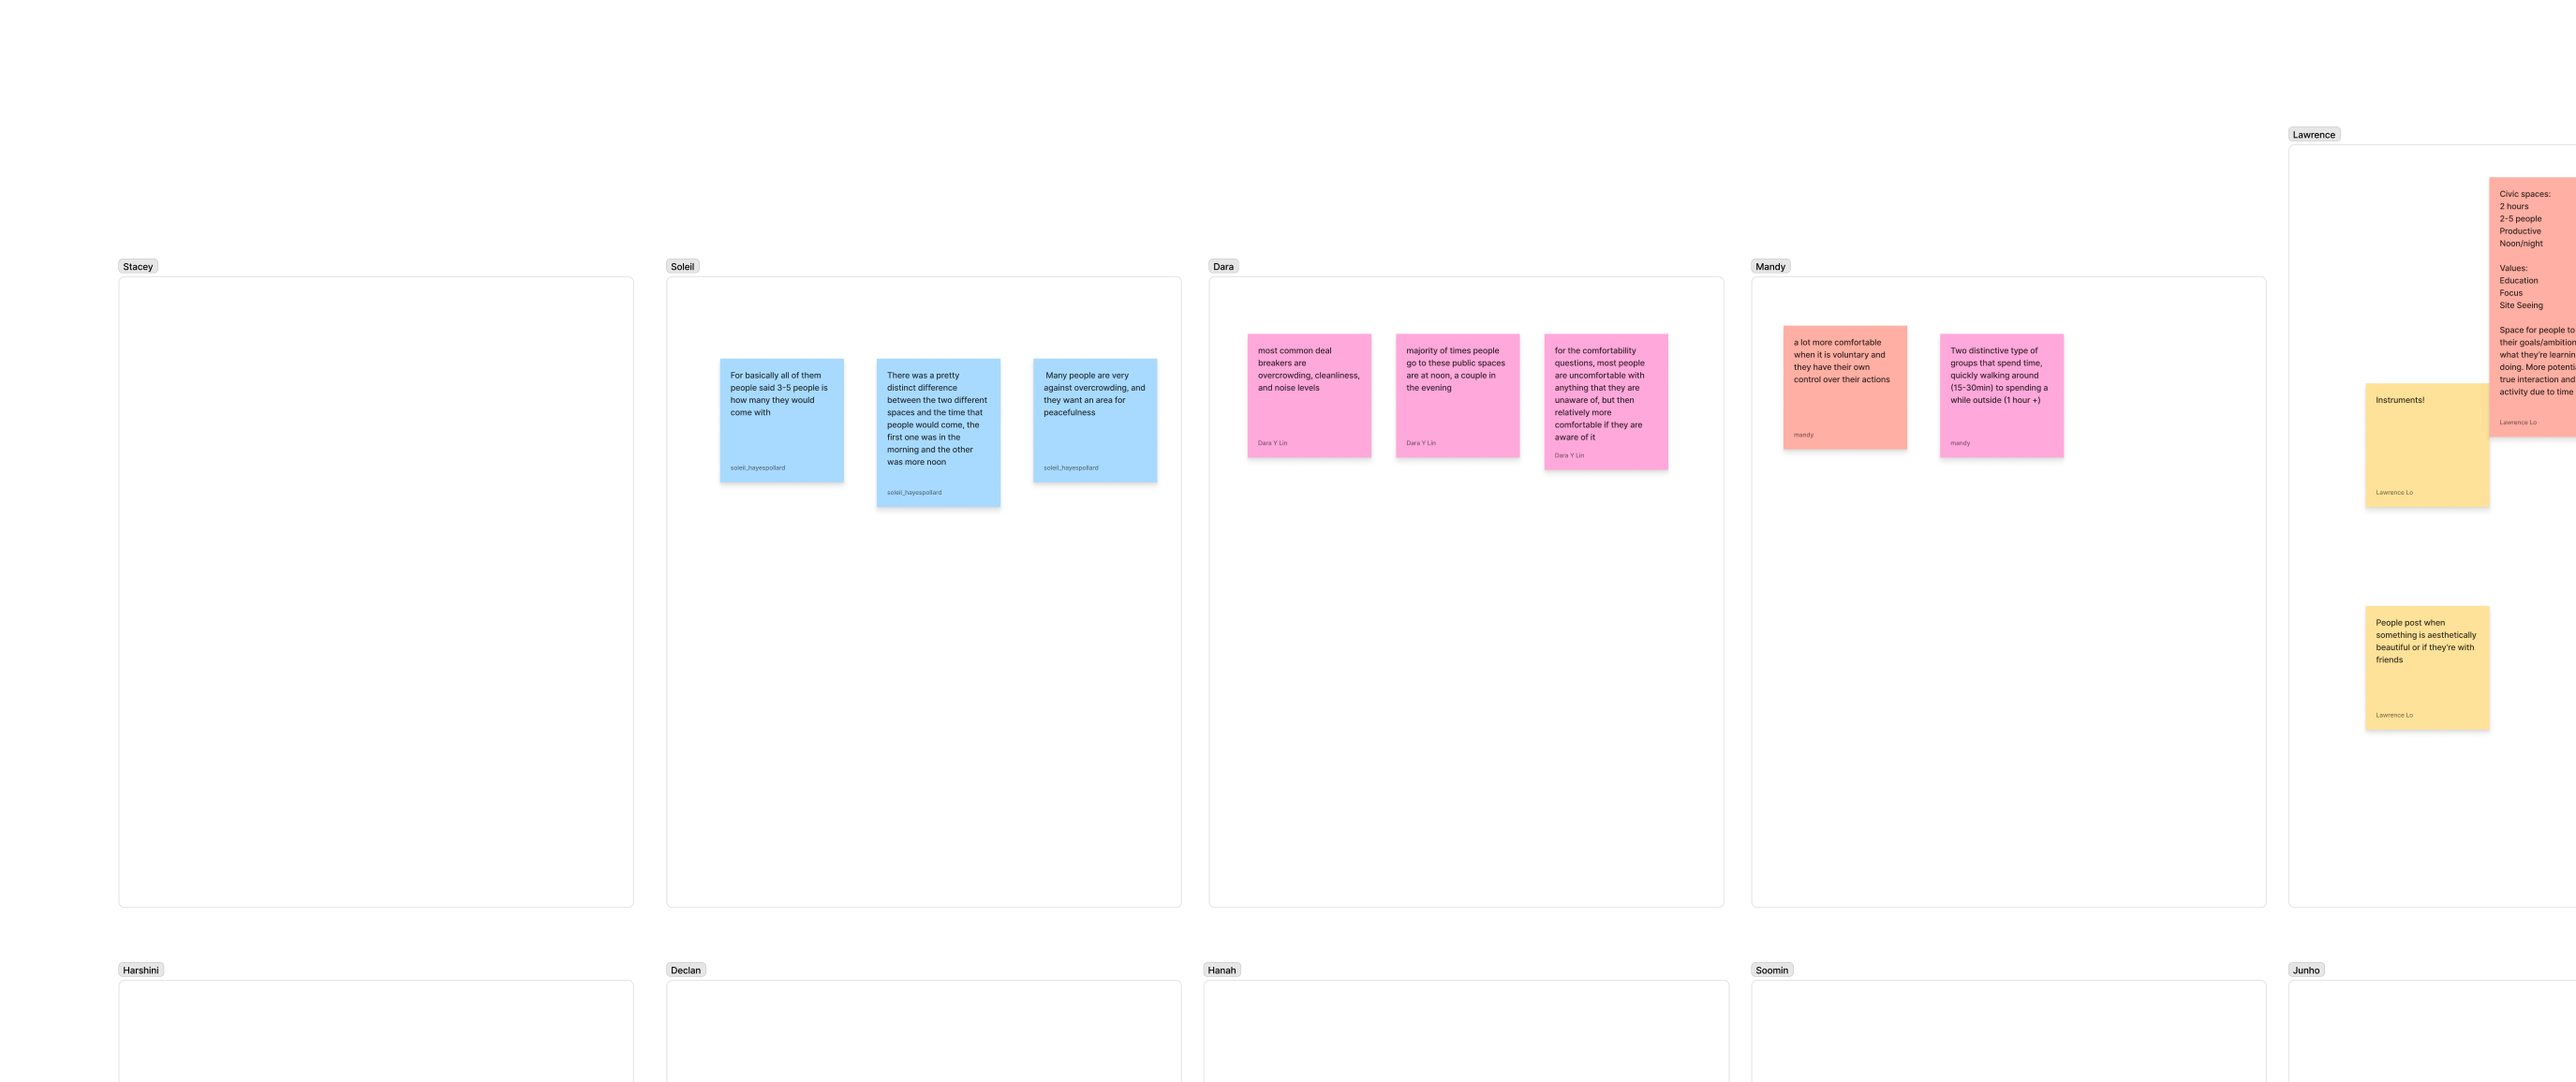
Each of the 9 consultants was asked to surface 2–3 patterns from the survey responses. The themes that emerged immediately:
  • Almost everyone visits public spaces in groups of 3–5 people
  • Overcrowding, cleanliness, and noise are the top deal-breakers
  • People are uncomfortable with anything they’re unaware of — but much more relaxed once they understand what an installation is doing
  • Behavior splits into two distinct modes: quick passers-by (15–30 min) and extended visitors (1+ hour)
Urban Conga — insight sticky notes per consultant
Phase 03 · Feb – Mar 2026

Space-type segmentation

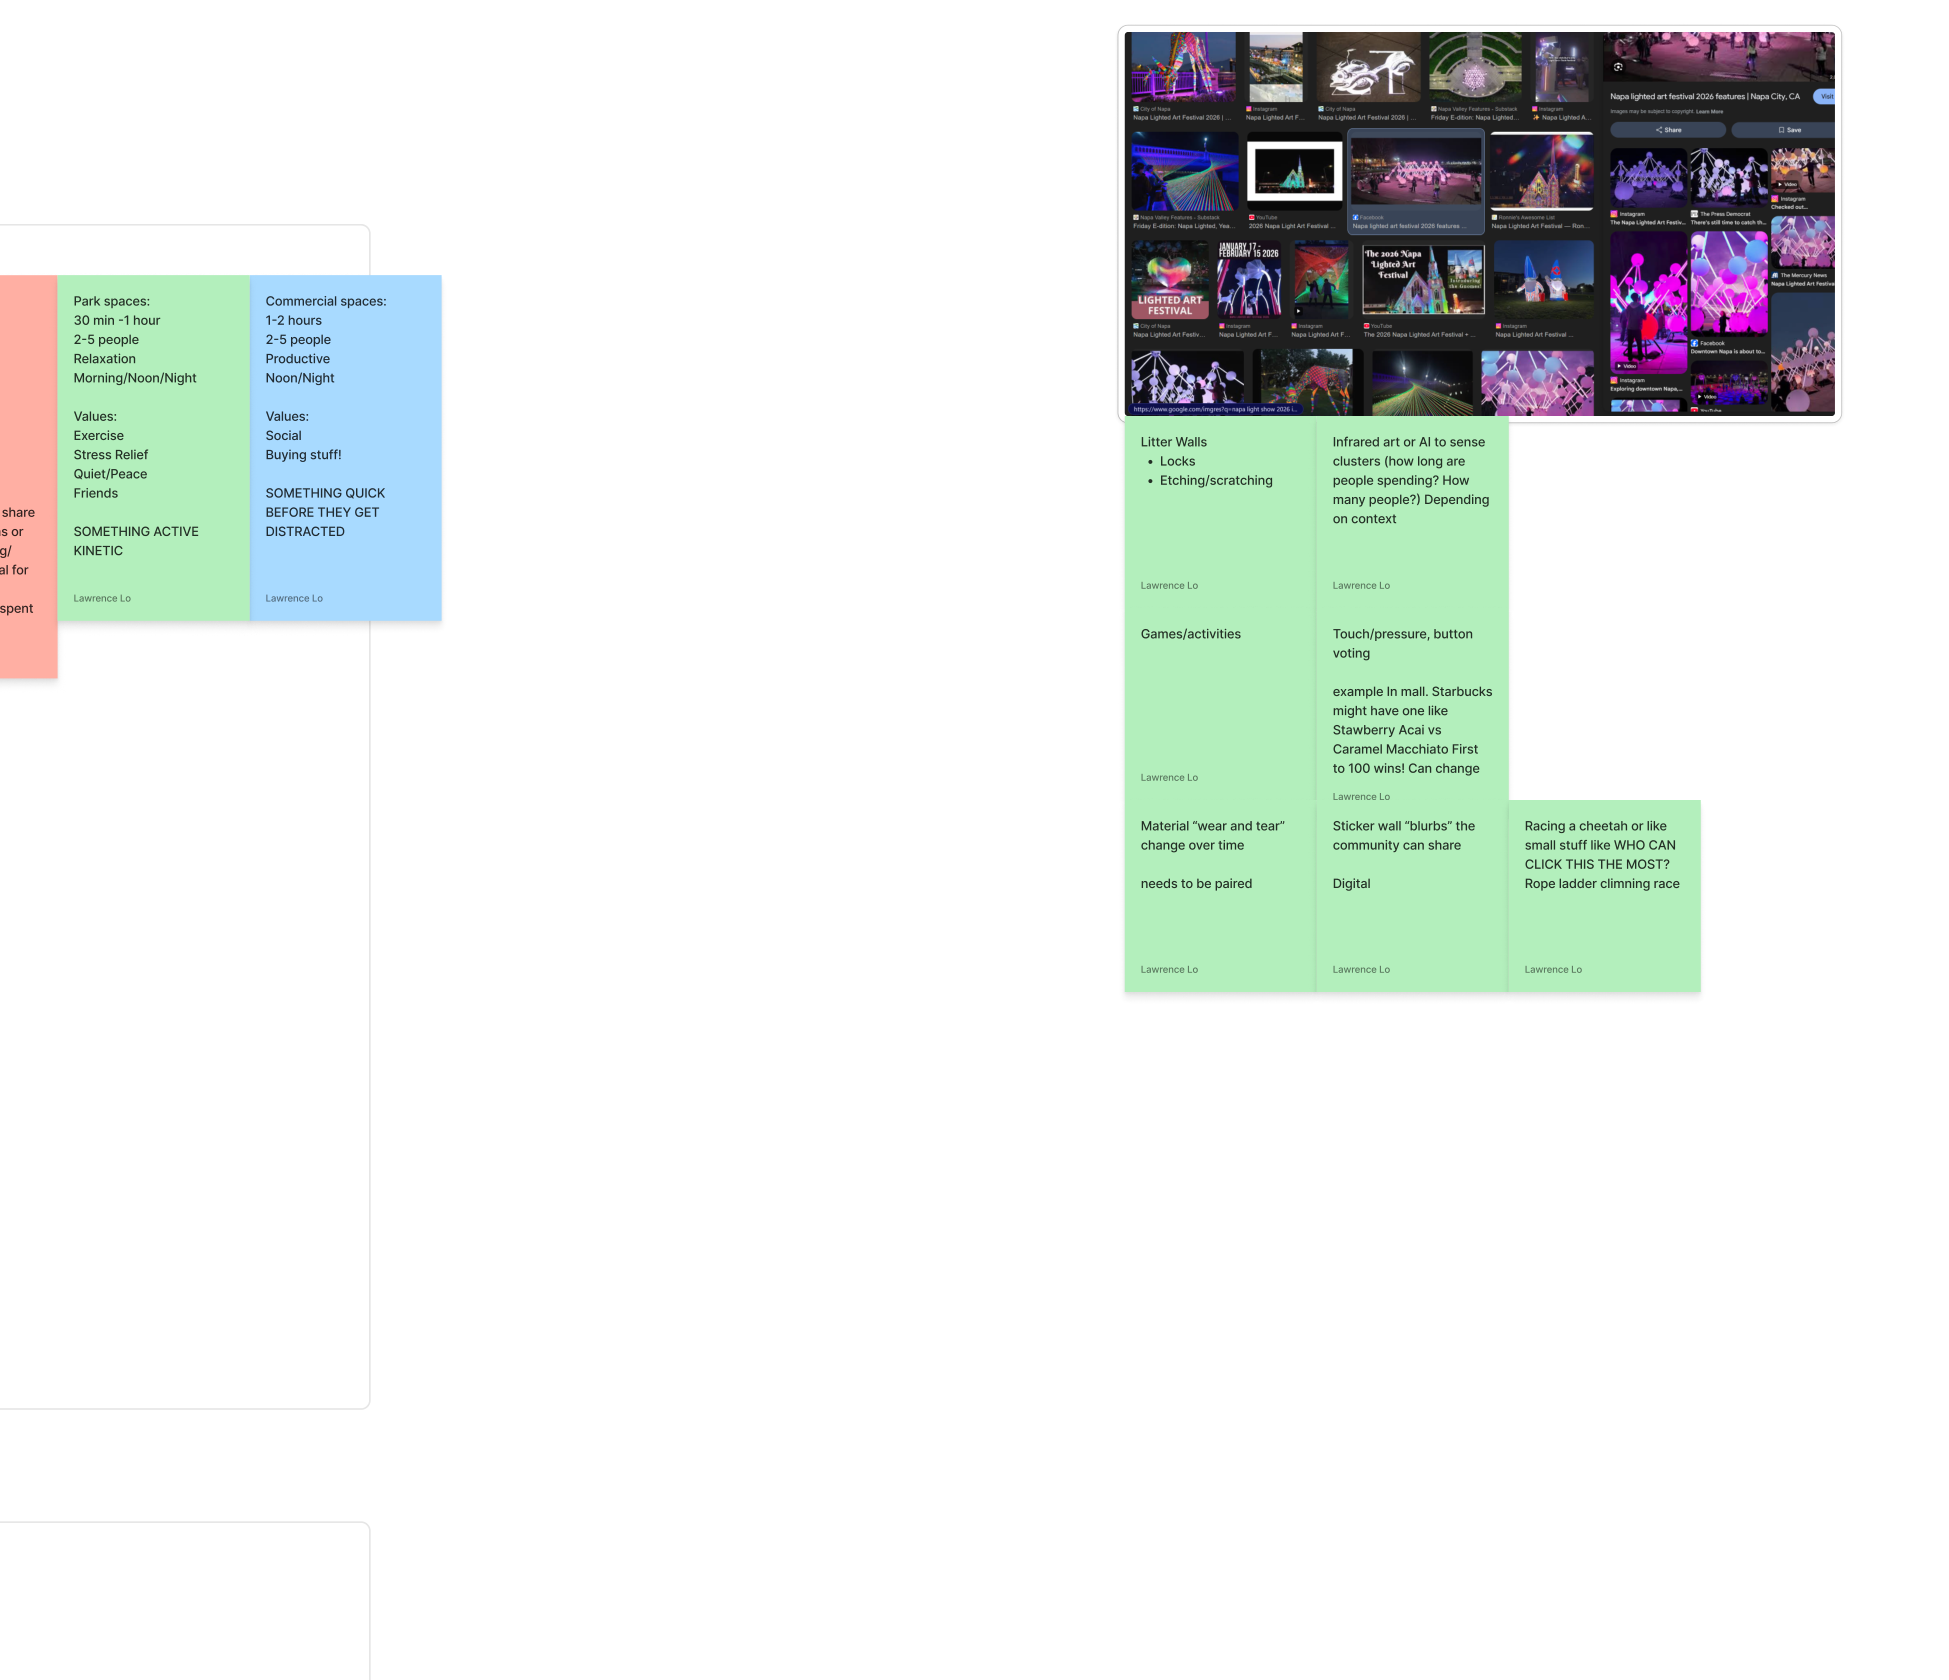
The team recognized that one installation concept can’t cover every context. We grouped responses into three space archetypes — each with its own usage signature, mood, and core values:
  • Civic spaces — 2 hours, 2–5 people, productive at noon/night, valuing education, focus, and sightseeing
  • Park spaces — 30 min–1 hour, relaxation-focused, valuing exercise, stress relief, quiet, and friends
  • Commercial spaces — 1–2 hours, productive at noon/night, social and purchase-driven
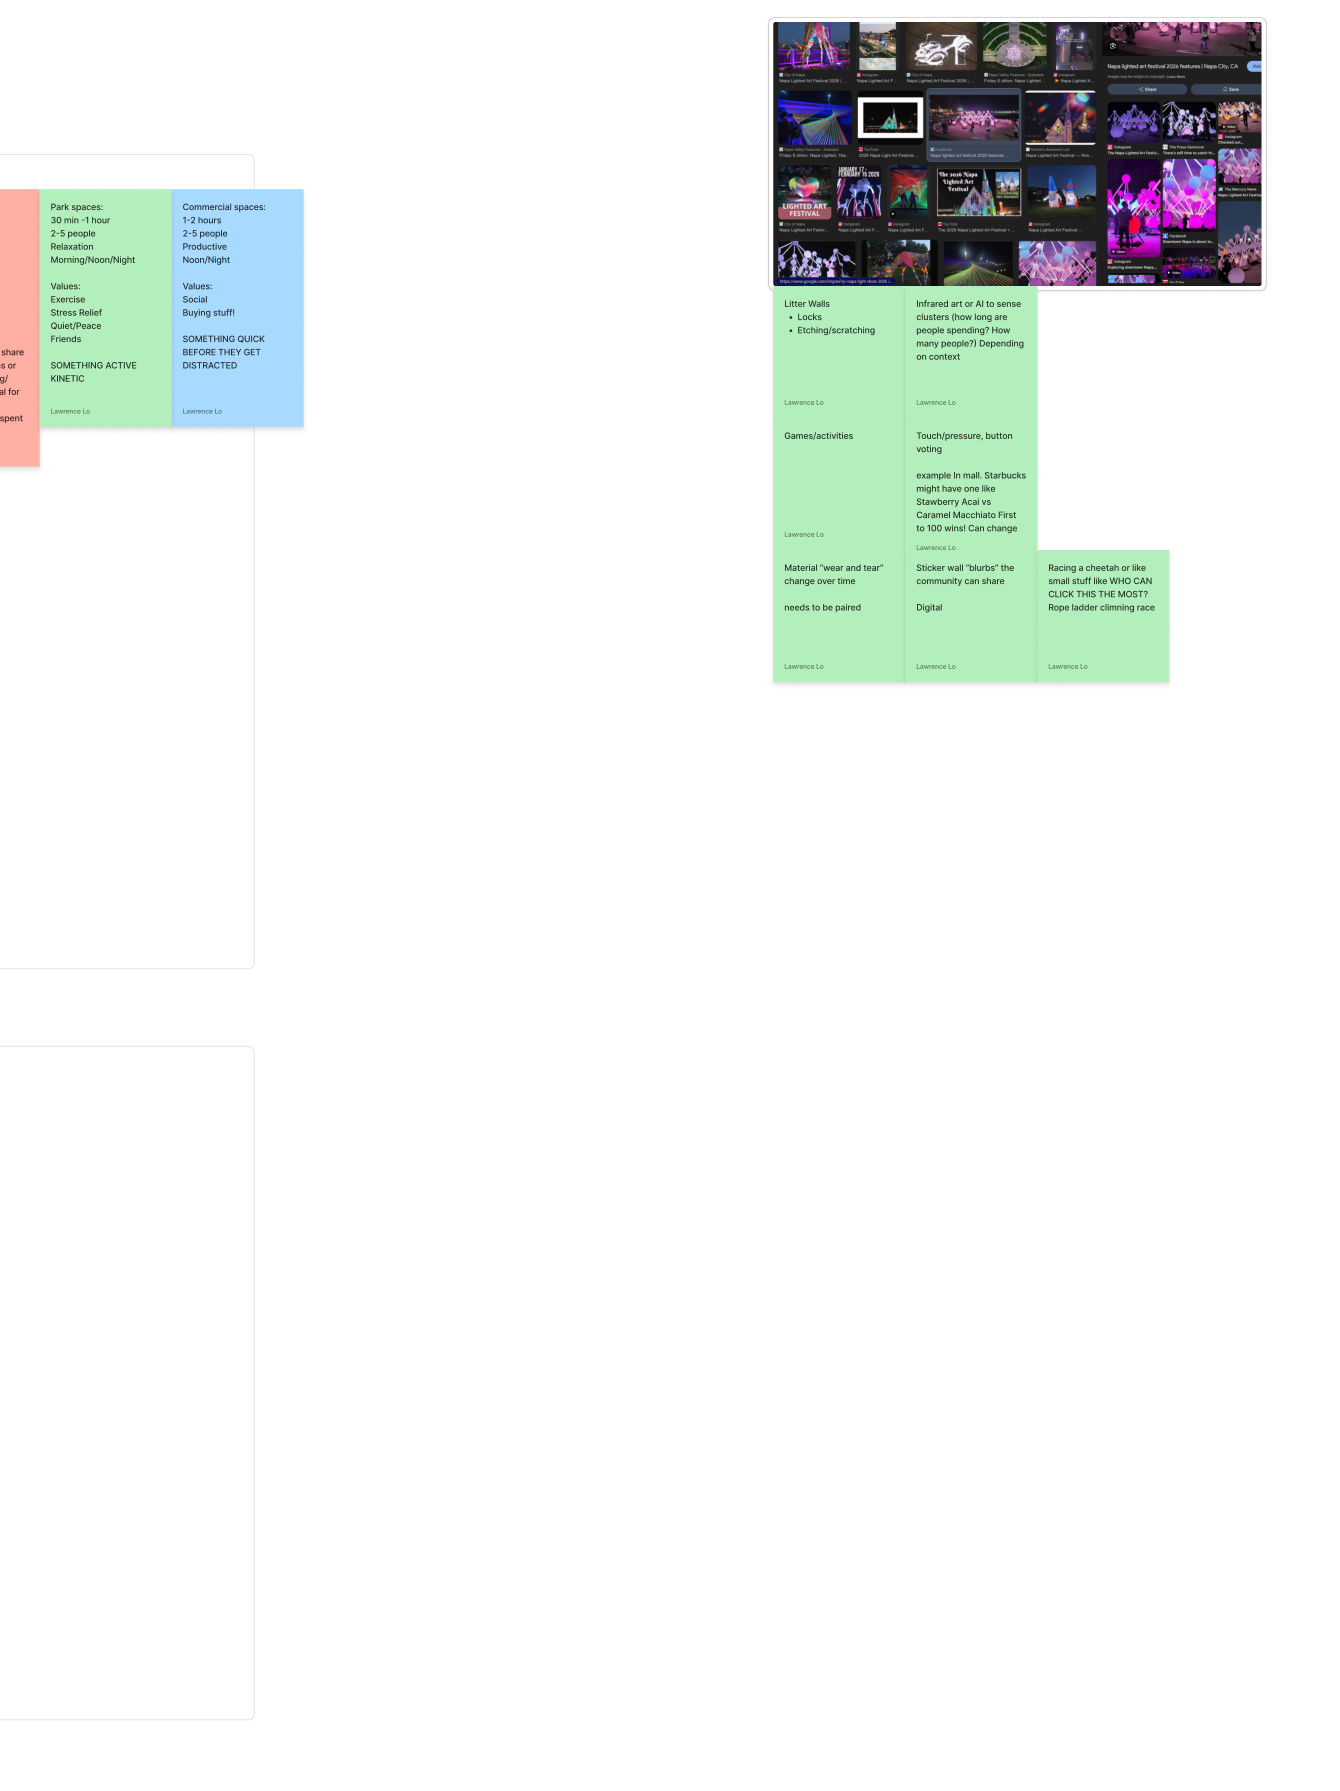
Urban Conga — space type breakdown cards (Civic / Park / Commercial)
Phase 04 · Mar 2026

Concept ideation

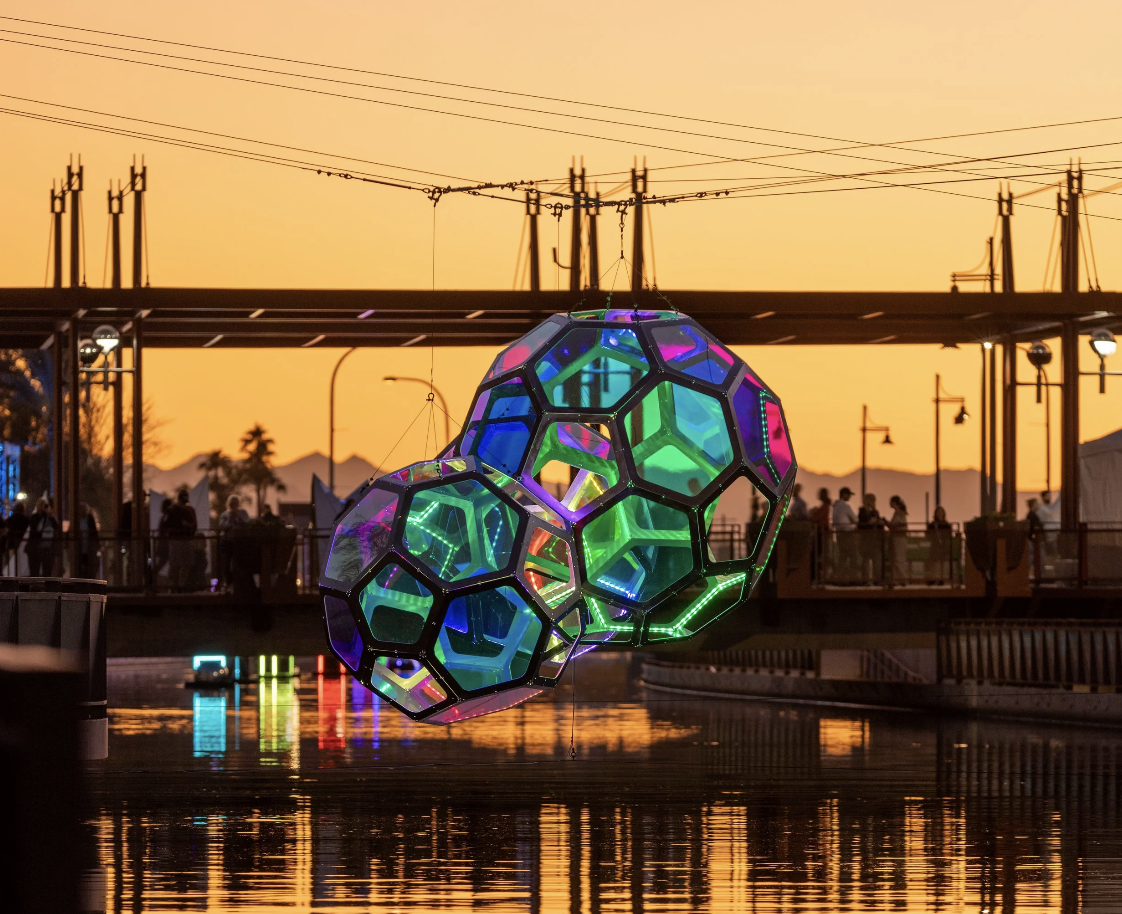
Each space archetype got its own installation direction. The brainstorm produced a long-list of physical and digital interaction concepts matched to the space’s mood:
  • Litter walls, locks, etching/scratching — permanence and trace-leaving in civic spaces
  • Infrared sensing & AI cluster detection — measuring how long and how many, depending on context
  • Touch / pressure / button voting — e.g. a Starbucks “Strawberry Acái vs. Caramel Macchiato first to 100” in a mall
  • Material wear-and-tear over time — the installation visibly changes from use
  • Sticker walls / community blurbs, kinetic park installations, racing/climbing micro-games
Urban Conga — installation concept ideation
Phase 05 · Apr 2026

Sensing & data-schema constraints

Translated the qualitative behavioral goals (“measure dwell time,” “count cluster size,” “detect voluntary engagement”) into structured, quantifiable data schemas with low-cost, low-overhead sensing approaches — capacitive touch, IR proximity, simple pressure switches.
Urban Conga — sensing schema area
Phase 06 · May – Jun 2026

Spatial & 3D layout in Rhino

Modeled candidate installation footprints in Rhino 3D, validating that each layout could host the inferred data flows from phase 5 while staying within the budget and footprint of a real public space. Closed the loop between behavior → sensing → physical form.
Urban Conga — installation reference + Rhino layout area
Outcome & reflection

TODO — final concept, Rhino renders, what Urban Conga took forward

01 / 08
모먹
04 Personal product · Web app

Momuk

오늘 뭐 먹지 — a menu suggester that answers what to eat, not where. It reads weather, air quality and time of day, scores 126 hand-tagged dishes, and shows the top reasons for its pick.

Role
Solo — design & build
Timeline
Aug 2026
Team
Personal project
Tools
HTML, CSS, JavaScript
Product DesignWeb AppRecommendation
The problem

TODO — the problem / why you built it

Phase 01 · TODO — dates

TODO — phase title

TODO — what you did, why, and what you learned
image / screen
Phase 02 · TODO — dates

TODO — phase title

TODO — what you did, why, and what you learned
image / screen
Phase 03 · TODO — dates

TODO — phase title

TODO — what you did, why, and what you learned
image / screen
Phase 04 · TODO — dates

TODO — phase title

TODO — what you did, why, and what you learned
image / screen
Outcome & reflection

TODO — final screens, live link, what you would change

01 / 06
GitHub ↗
Replate
05 Data dashboard · Product design

Replate

Analyzing Replate’s large-scale user data to design and build a website dashboard used by both donors and the company.

Role
TODO — role
Timeline
TODO — dates
Team
Invention Corps of Berkeley
Tools
TODO — tools
DashboardData VizProduct Design
The problem

TODO — the problem / users (donors vs. Replate team)

Phase 01 · TODO — dates

TODO — phase title

TODO — what you did, why, and what you learned
image / screen
Phase 02 · TODO — dates

TODO — phase title

TODO — what you did, why, and what you learned
image / screen
Phase 03 · TODO — dates

TODO — phase title

TODO — what you did, why, and what you learned
image / screen
Phase 04 · TODO — dates

TODO — phase title

TODO — what you did, why, and what you learned
image / screen
Outcome & reflection

TODO — dashboard screens, impact

01 / 06